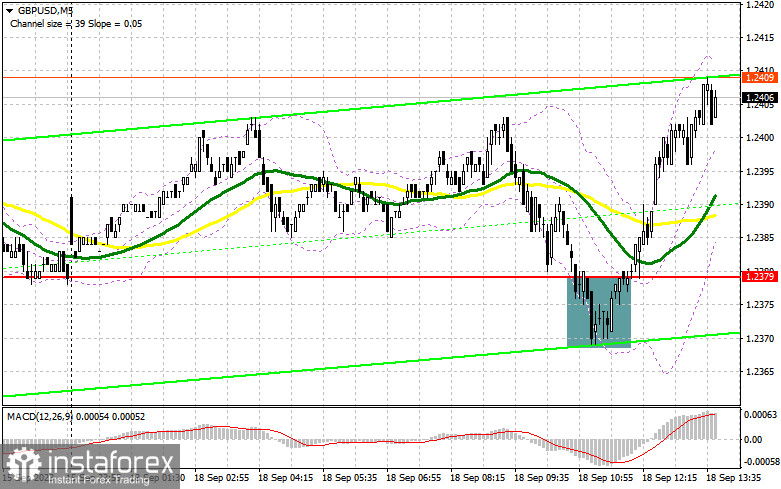
In my morning forecast, I drew attention to the level of 1.2379 and recommended making trading decisions based on it. Let's look at the 5-minute chart and analyze what happened there. The decline and the formation of a false breakout at 1.2379 resulted in a buy signal, leading to an increase in the pair by almost 30 pips. The technical picture was completely revised in the second half of the day.
To open long positions on GBP/USD, the following is required:
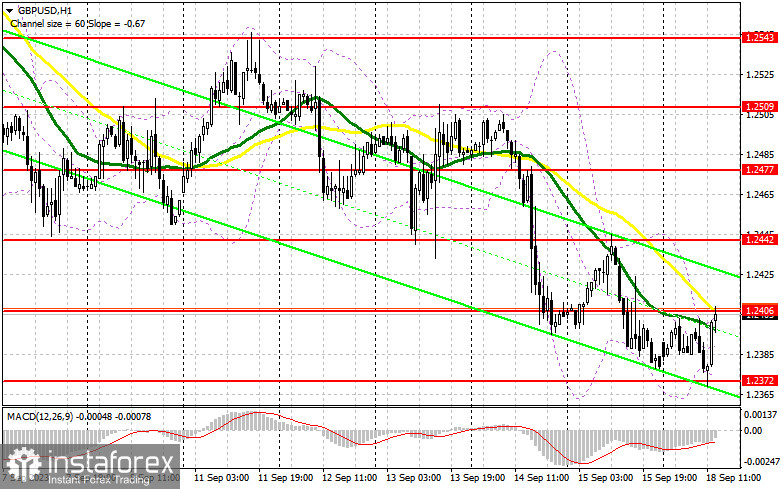
Considering the low trading volume and the rather weak bearish activity near the monthly low, it is possible to continue relying on an upward correction of the pair in the second half of the day. However, I would prefer to act against the bearish market conditions in low volatility only after another drop in GBP/USD and a false breakout at 1.2372 – a new support formed due to the first half of the day. In this case, the target will be a new resistance level at 1.2406, where the moving averages are currently located, favoring sellers. A breakout and consolidation above this range will strengthen buyers' confidence, providing a signal to open long positions with an exit towards 1.2442, where I expect more significant sellers to appear. The ultimate target will be around 1.2477, where I will take profits. In the scenario of a drop to 1.2372 and the absence of buyer activity there in the second half of the day, the pressure on the pound will only increase, opening the way to new monthly lows. In this case, only the defense of 1.2340 and a false breakout there will signal the opening of long positions. I plan to buy GBP/USD immediately on a bounce from the 1.2308 minimum with a 30-35 point correction target within the day.
To open short positions on GBP/USD, the following is required:
It is obvious that only the defense of the nearest resistance at 1.2406 and a false breakout at this level in the second half will be a suitable entry point for short positions, leading the way back to the monthly minimum of 1.2372. A breakout and reverse test from below to above this range will deal a more serious blow to the positions of the bulls, providing an opportunity for a decline to the support at 1.2340. The more distant target remains around 1.2308, where I will take profits. In the case of an upward movement of GBP/USD during the American session and the absence of activity at 1.2406, where sellers should show themselves fairly quickly, buyers will have an excellent opportunity for a correction at the beginning of the week before the important inflation report expected on Wednesday. In this case, I will postpone selling until a false breakout at 1.2442. If there is no downward movement, I will sell the pound immediately on a bounce from 1.2477, but only in anticipation of a downward correction of the pair by 30-35 points within the day.
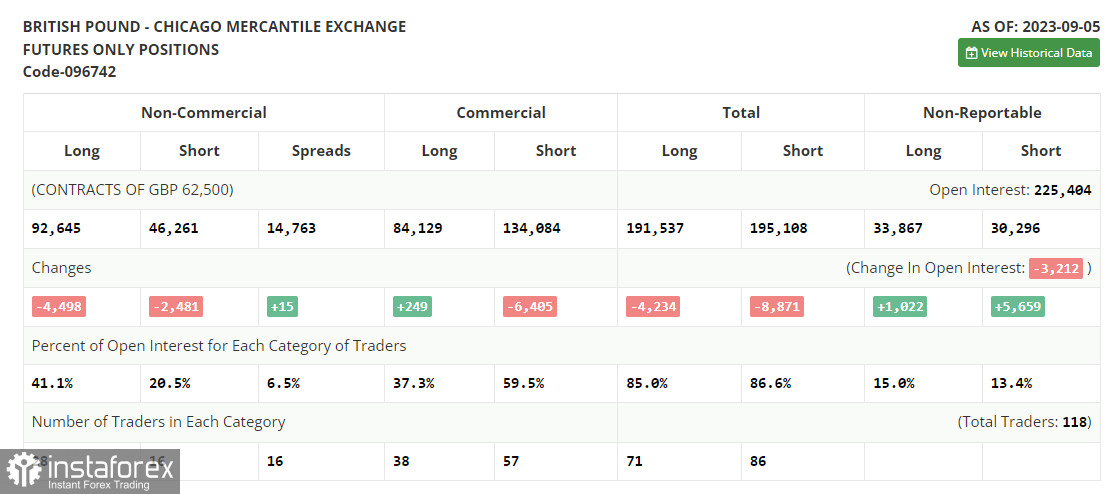
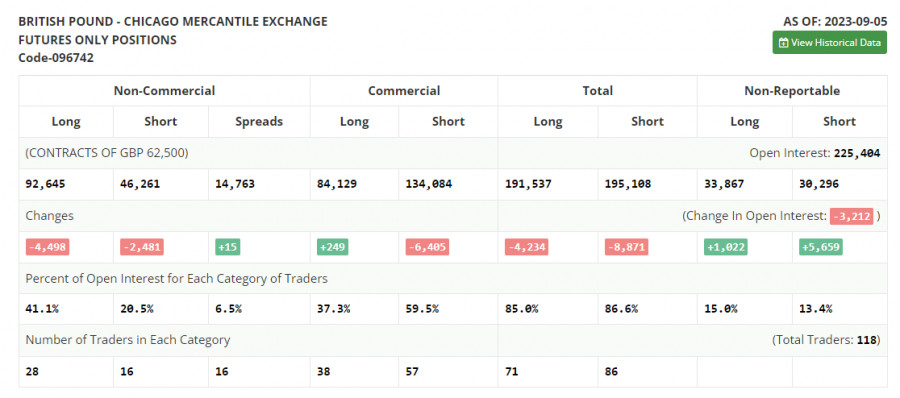
In the COT report (Commitment of Traders) for September 5th, there was a reduction in both long and short positions. Statements by Bank of England Governor Andrew Bailey caused quite a stir, leading to a fairly active decline in the pound last week. Hints of possible abandonment of further aggressive policies by the regulator in favor of maintaining the pace of economic growth were not welcomed by buyers, as it is evident that the Federal Reserve of the United States, which has made much more progress in fighting inflation, is not planning to do the same. The difference in interest rates makes the dollar more attractive and puts pressure on the pound. However, buyers may take advantage of a fairly strong GBP/USD selloff at any time, as the lower the pound, the more attractive it is for mid-term buying. In the latest COT report, it is stated that long non-commercial positions decreased by 4,498 to the level of 92,645, while short non-commercial positions decreased by 2,481 to 46,261. As a result, the spread between long and short positions increased by only 15. The weekly price dropped and reached 1.2567 against 1.2624.
Indicator Signals:
Moving averages
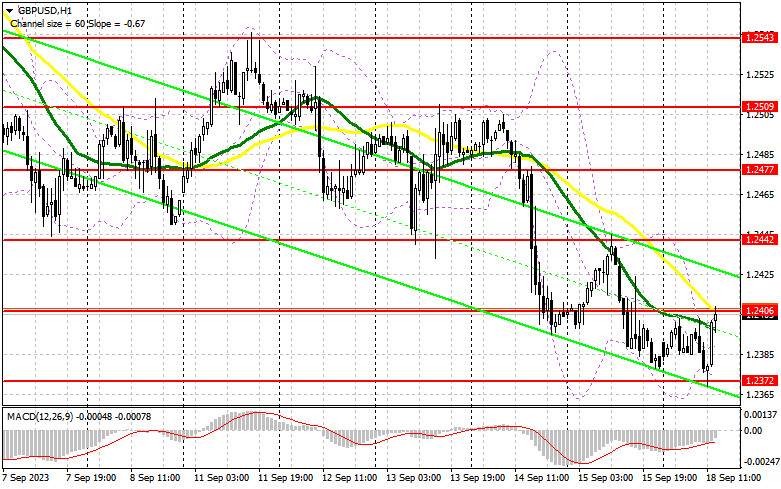
Trading is taking place below the 30 and 50-day moving averages, indicating the likelihood of further pound depreciation.
Note: The period and prices of moving averages considered by the author are on the hourly H1 chart and differ from the general definition of classical daily moving averages on the daily D1 chart.
Bollinger Bands
In the event of a decline, the lower boundary of the indicator at around 1.2372 will act as support.
Description of Indicators:
• Moving Average (a moving average that determines the current trend by smoothing out volatility and noise). Period 50. Marked in yellow on the chart.
• Moving Average (a moving average that determines the current trend by smoothing out volatility and noise). Period 30. Marked in green on the chart.
• MACD Indicator (Moving Average Convergence/Divergence — convergence/divergence of moving averages) Fast EMA period 12. Slow EMA period 26. SMA period 9.
• Bollinger Bands. Period 20.
• Non-commercial traders - speculators, such as individual traders, hedge funds, and large institutions, using the futures market for speculative purposes and meeting certain requirements.
• Long non-commercial positions represent the total long open positions of non-commercial traders.
• Short non-commercial positions represent the total short open positions of non-commercial traders.
• The total non-commercial net position is the difference between non-commercial traders' short and long positions.