empty
19.09.2023 08:31 AM
Outlook for GBP/USD on September 19. COT report. Absolute flat before the "storm"

Analysis of GBP/USD 5M

This image is no longer relevant

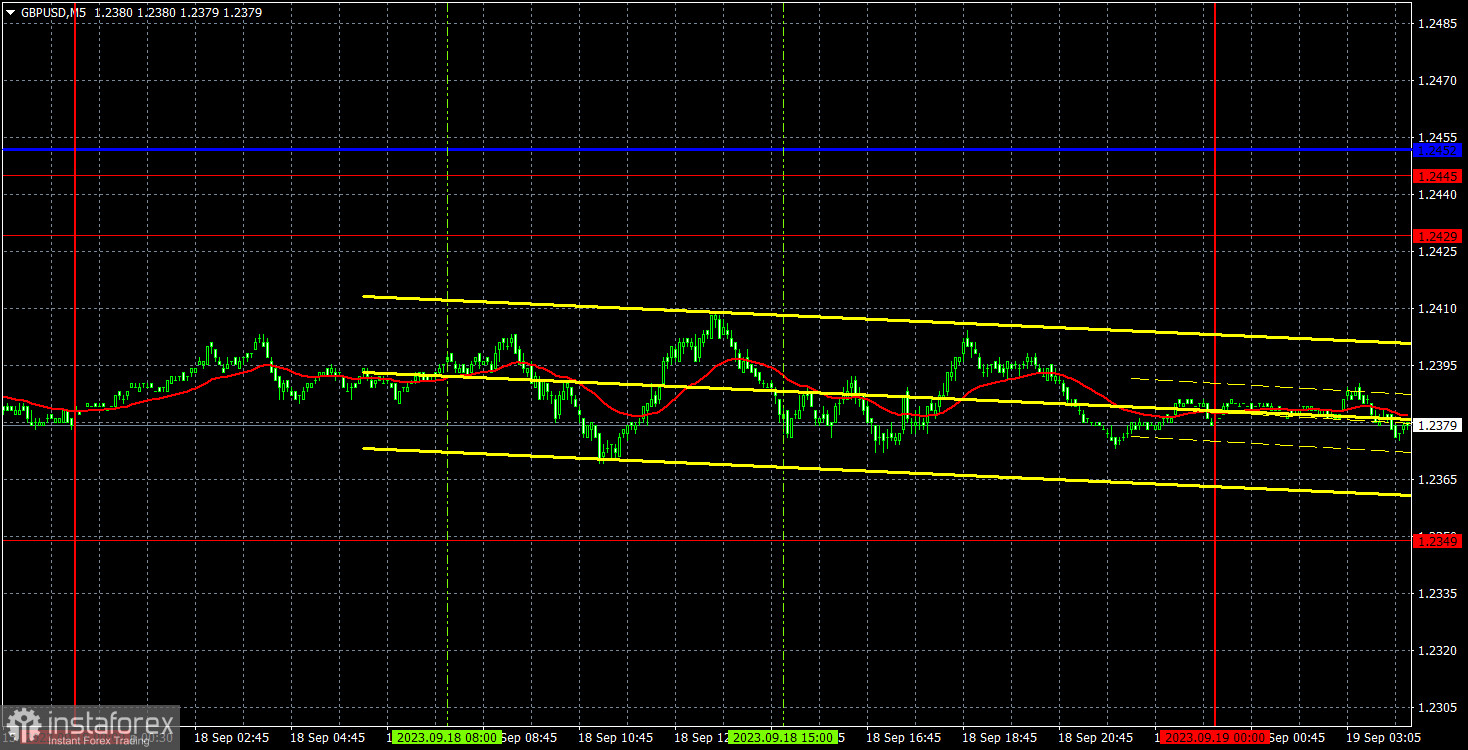
On Monday, GBPUSD was in a flat phase. There were no important events or reports in either the UK or the US. As a result, there was no interesting movement to work with. The price didn't even approach important levels and lines to form a trading signal. Therefore, the current situation fits very well with the expression "the calm before the storm." It's worth noting that on Wednesday, the UK will release an inflation report, while the Federal Reserve will hold its meeting. Afterwards, the Bank of England's meeting will take place on Thursday. Thus, the most important events of the week, which the market will find extremely hard to ignore, are just ahead. But be careful— the pair's movement can be absolutely unpredictable. Even if the BoE decides to raise interest rates, the British pound could still fall, similar to what happened with the euro last Thursday.

It was not possible to identify any trading signals on Monday because the price moved with just a range of 40 pips strictly between the levels of 1.2349 and 1.2429, without approaching either of them. Therefore, there were no signals, and it was better not to enter the market. Volatility could spike as early as tomorrow, which is also not the most favorable time for trading. However, at least volatility may increase.

COT report:

This image is no longer relevant

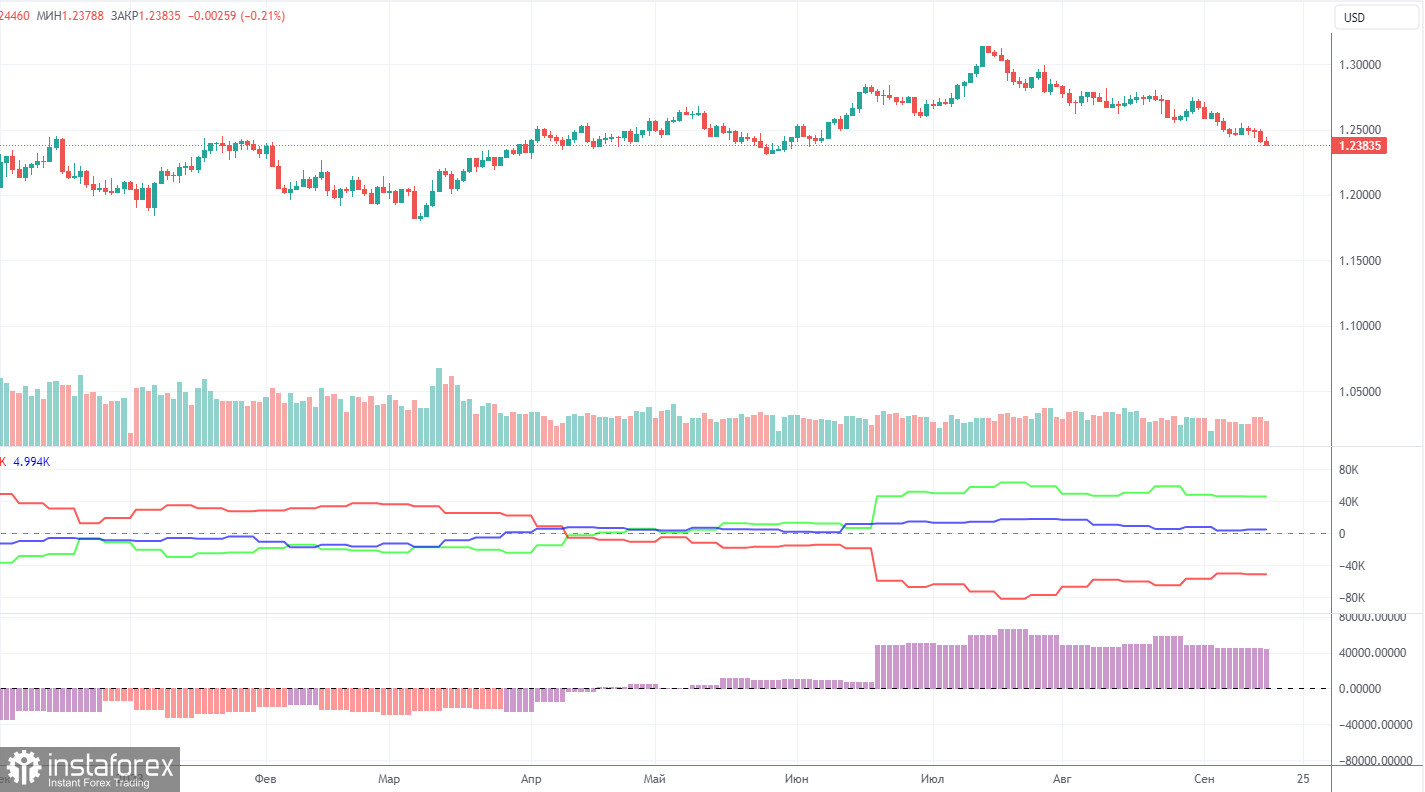
According to the latest COT report on GBP/USD, the Non-commercial group has 4,700 long positions and 4,900 short positions. Thus, the net position of non-commercial traders decreased by 200 contracts over the week. The net position indicator has been steadily increasing over the past 12 months and remains high, while the British pound is still not in a hurry to fall sharply. However, the pound sterling has started to fall in the last two months. If the pound had been rising for a year before, why should it start to fall rapidly now? Perhaps we are at the very beginning of a protracted downtrend.

The British currency has jumped by a total of 2,800 pips from its absolute lows reached last year. All in all, it has been a stunning rally without a strong downward correction. Thus, further growth would be utterly illogical. We're not against the upward trend. We just believe GBP/USD needs a good downward correction first and then assess the factors supporting the dollar and the pound. The Non-commercial group currently holds a total of 97,400 longs and 51,100 shorts. We remain skeptical about the long-term growth of the British currency, as we do not see any fundamental and macroeconomic reasons for it.

Analysis of GBP/USD 1H

This image is no longer relevant

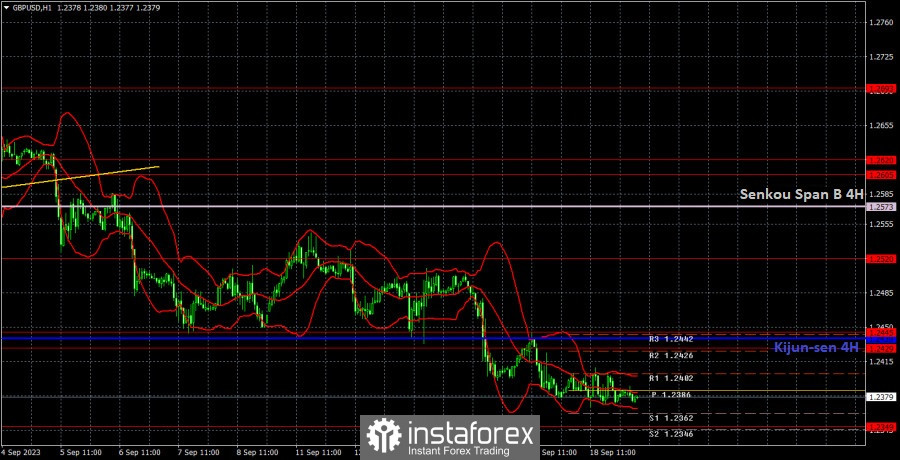
On the 1H chart, GBP/USD continues its weak downward movement. The pound sterling is still poised to decline and can't correct upwards. Traders are now sitting on the sidelines of the BoE and FOMC meetings. The British pound may very well sink even lower as the market is currently not interested in the uptrend for obvious reasons. This is entirely reasonable since the pound remains overbought and lacks a fundamental backdrop for a bullish move.

On September 19, traders should pay attention to the following key levels: 1.2188, 1.2269, 1.2349, 1.2429-1.2445, 1.2520, 1.2605-1.2620, 1.2693, 1.2786, 1.2863. The Senkou Span B (1.2573) and Kijun-sen (1.2439) lines can also be sources of signals, e.g. rebounds and breakout of these levels and lines. It is recommended to set the Stop Loss orders at the breakeven level when the price moves in the right direction by 20 pips. The lines of the Ichimoku indicator can move during the day, which should be taken into account when determining trading signals. There are support and resistance levels that can be used to lock in profits.

On Tuesday, the UK calendar is devoid of any major events, while the US is slated for a secondary report on building permits issuance. It's been a while since this report triggered any significant market response. Most likely, we should brace ourselves for another low-volatility day, predominantly marked by a flat.

Description of the chart:

Support and resistance levels are thick red lines near which the trend may end. They do not provide trading signals;

The Kijun-sen and Senkou Span B lines are the lines of the Ichimoku indicator, plotted to the 1H timeframe from the 4H one. They provide trading signals;

Extreme levels are thin red lines from which the price bounced earlier. They provide trading signals;

Yellow lines are trend lines, trend channels, and any other technical patterns;

Indicator 1 on the COT charts is the net position size for each category of traders;

Indicator 2 on the COT charts is the net position size for the Non-commercial group.

Paolo Greco,
Analytical expert of InstaForex
© 2007-2025
Select timeframe
5
min
15
min
30
min
1
hour
4
hours
1
day
1
week
Earn on cryptocurrency rate changes with InstaForex
Download MetaTrader 4 and open your first trade
  • Grand Choice
    Contest by
    InstaForex
    InstaForex always strives to help you
    fulfill your biggest dreams.
    JOIN CONTEST

Recommended Stories

How to Trade the EUR/USD Pair on May 19? Simple Tips and Trade Analysis for Beginners

Analysis of Friday's Trades 1H Chart of EUR/USD On Friday, the EUR/USD currency pair declined significantly in price, despite no macroeconomic or fundamental reasons. However, the downward trend

Paolo Greco 08:19 2025-05-19 UTC+2

Trading Recommendations and Analysis for GBP/USD on May 19: The Pound Feels Comfortable in a Flat Market

On Friday, the GBP/USD currency pair mainly traded downward throughout the day but closed with only a minor decline. This was mostly because the dollar weakened during the Asian session

Paolo Greco 04:42 2025-05-19 UTC+2

Trading Recommendations and Analysis for EUR/USD on May 19: The Dollar Struggles to Grow, but Still Does

The EUR/USD currency pair showed a slight decline on Friday. Although the 5-minute chart might suggest the pair spent the entire day in a downtrend, the U.S. dollar gained only

Paolo Greco 04:42 2025-05-19 UTC+2

How to Trade the GBP/USD Pair on May 19? Simple Tips and Trade Analysis for Beginners

Analysis of Friday's Trades 1H Chart of GBP/USD On Friday, the GBP/USD pair also traded lower, although there were no objective reasons. While the euro maintains a downward trend

Paolo Greco 00:35 2025-05-19 UTC+2

How to Trade the GBP/USD Pair on May 16? Simple Tips and Trade Analysis for Beginners

Analysis of Thursday's Trades 1H Chart of GBP/USD On Thursday, the GBP/USD pair showed minimal upward movement; however, the 5-minute timeframe indicates this was largely a sideways move

Paolo Greco 06:17 2025-05-16 UTC+2

How to Trade the EUR/USD Pair on May 16? Simple Tips and Trade Analysis for Beginners

Analysis of Thursday's Trades 1H Chart of EUR/USD The EUR/USD currency pair traded in both directions throughout Thursday. The macroeconomic background was rich, but it had no decisive impact

Paolo Greco 06:17 2025-05-16 UTC+2

Trading Recommendations and Analysis for GBP/USD on May 16: The Pound Decided to Take a Break

On Thursday, the GBP/USD currency pair traded strictly sideways with low volatility. Despite a busy macroeconomic calendar, the market ignored most of the data, just as anticipated

Paolo Greco 03:54 2025-05-16 UTC+2

Trading Recommendations and Analysis for EUR/USD on May 16: The Market Has Once Again Confirmed the Obvious

On Thursday, the EUR/USD currency pair showed only one thing—a complete unwillingness to move. We observed sideways movement throughout the day despite a fairly packed macroeconomic calendar. However, as mentioned

Paolo Greco 03:54 2025-05-16 UTC+2

How to Trade the GBP/USD Pair on May 15? Simple Tips and Trade Analysis for Beginners

Analysis of Wednesday's Trades 1H Chart of GBP/USD The GBP/USD pair continued its upward movement throughout Wednesday, despite the absence of any specific fundamental reasons. The day before, a U.S

Paolo Greco 06:21 2025-05-15 UTC+2

How to Trade the EUR/USD Pair on May 15? Simple Tips and Trade Analysis for Beginners

Analysis of Wednesday's Trades 1H Chart of EUR/USD The EUR/USD currency pair experienced upward movement for approximately half of Wednesday. The latest "surge" in the euro was particularly "impressive," although

Paolo Greco 06:21 2025-05-15 UTC+2
Can't speak right now?
Ask your question in the chat.
Widget callback
 

Dear visitor,

Your IP address shows that you are currently located in the USA. If you are a resident of the United States, you are prohibited from using the services of InstaFintech Group including online trading, online transfers, deposit/withdrawal of funds, etc.

If you think you are seeing this message by mistake and your location is not the US, kindly proceed to the website. Otherwise, you must leave the website in order to comply with government restrictions.

Why does your IP address show your location as the USA?

  • - you are using a VPN provided by a hosting company based in the United States;
  • - your IP does not have proper WHOIS records;
  • - an error occurred in the WHOIS geolocation database.

Please confirm whether you are a US resident or not by clicking the relevant button below. If you choose the wrong option, being a US resident, you will not be able to open an account with InstaForex anyway.

We are sorry for any inconvenience caused by this message.