empty
20.01.2025 02:16 PM
Weekly Forecast Based on Simplified Wave Analysis for GBP/USD, AUD/USD, USD/CHF, EUR/JPY, EUR/CHF, and US Dollar Index on January 20th

GBP/USD

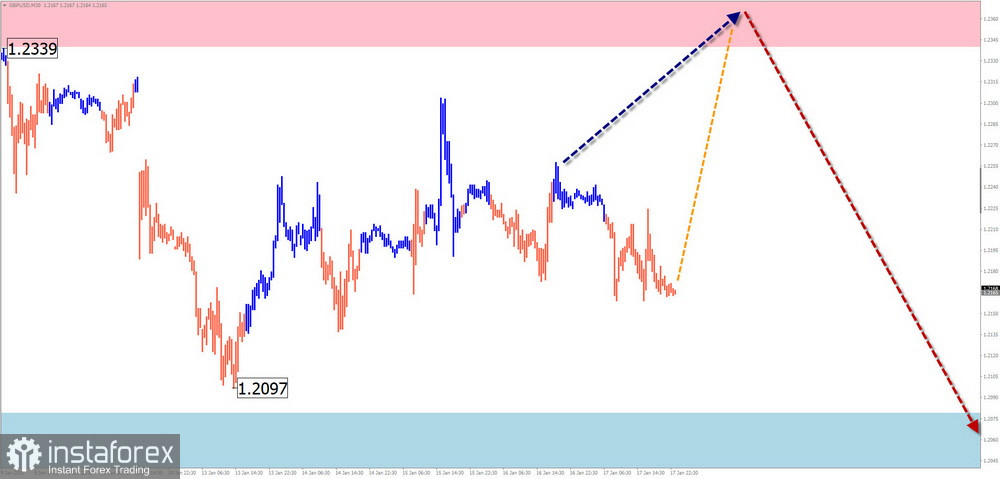
Analysis:The latest wave structure for GBP/USD, initiated in August last year, remains incomplete and is descending. This section serves as a correction within a larger wave. Over the past week, the pair has been forming an intermediate pullback.

Forecast:This week, GBP/USD is likely to continue moving sideways within a flat pattern. A brief rise toward resistance is possible in the early days, followed by a reversal and a downward movement. Volatility is expected to increase toward the weekend.

This image is no longer relevant

Potential Reversal Zones:

  • Resistance: 1.2340–1.2390
  • Support: 1.2080–1.2030

Recommendations:

  • Buy: Limited potential and high risk.
  • Sell: Consider trades after reversal signals near the resistance zone are confirmed by your trading systems (TS).

AUD/USD

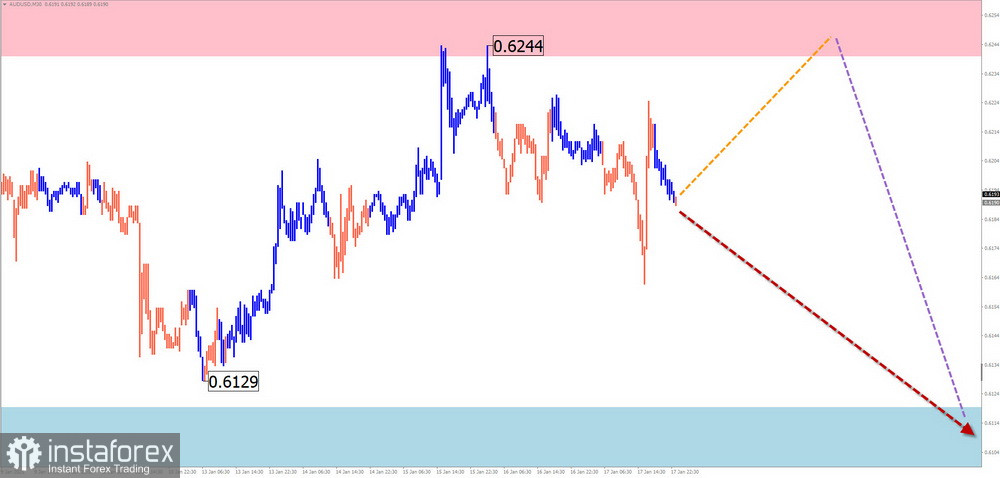
Analysis:The descending wave for AUD/USD, starting September 30 last year, has brought prices to a significant potential reversal zone. Over the past month, the wave has formed a flat correction in the form of a shifting flat structure, which remains incomplete.

Forecast:The pair is expected to continue its sideways movement this week. After potential pressure on the resistance zone, a reversal and a downward move toward support are likely.

This image is no longer relevant

Potential Reversal Zones:

  • Resistance: 0.6240–0.6290
  • Support: 0.6120–0.6070

Recommendations:

  • Buy: High risk, may result in losses.
  • Sell: Premature without confirmed reversal signals near resistance.

USD/CHF

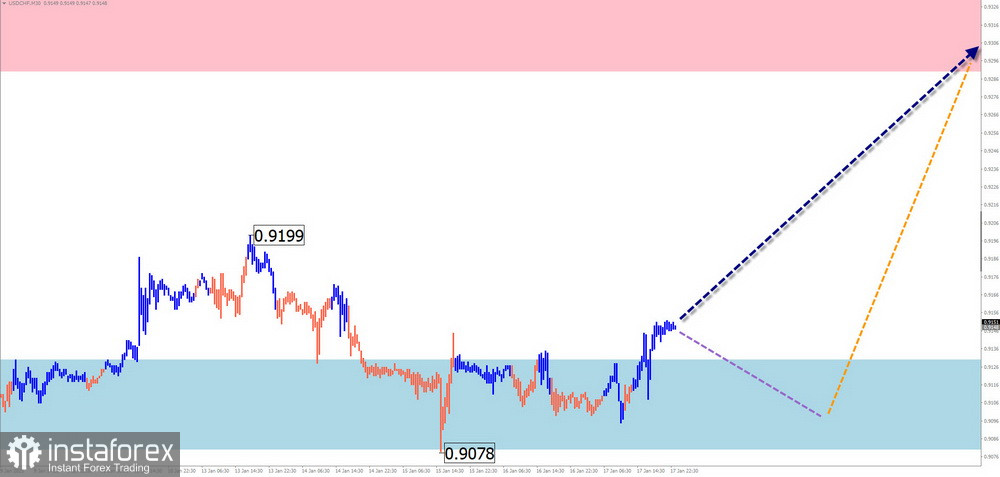
Analysis:The short-term direction for USD/CHF has been defined by an upward wave since August last year, which remains incomplete. The wave scale exceeds the H4 timeframe, and the price has breached an intermediate resistance zone. A correction appears necessary.

Forecast:In the early days of the week, expect sideways movement with possible pressure on the lower boundary of the support zone. Later, a reversal and upward continuation are likely, with resistance at the lower edge of the wave's preliminary target zone.

This image is no longer relevant

Potential Reversal Zones:

  • Resistance: 0.9290–0.9340
  • Support: 0.9130–0.9080

Recommendations:

  • Sell: No potential and high risk.
  • Buy: Consider after confirmed reversal signals within the support zone.

EUR/JPY

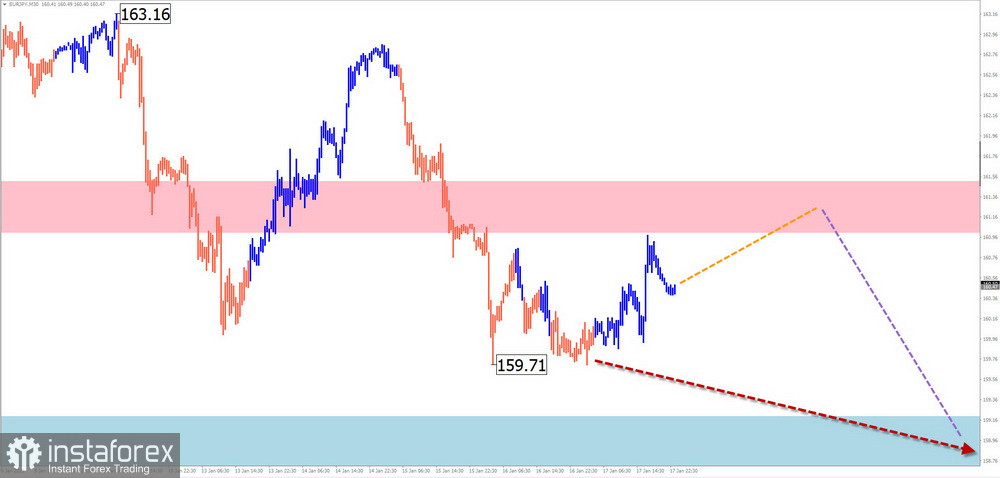
Analysis:Since late December, EUR/JPY has been forming a descending wave, correcting the latest section of the global trend. The wave forms a stretched flat structure and remains incomplete.

Forecast:Expect overall sideways movement this week. After potential pressure on the resistance zone, a reversal and downward continuation are likely. The calculated support lies at the upper boundary of the wave's preliminary target zone.

This image is no longer relevant

Potential Reversal Zones:

  • Resistance: 161.00–161.50
  • Support: 159.20–158.70

Recommendations:

  • Buy: Limited potential and high risk.
  • Sell: Becomes viable after confirmed reversal signals in the resistance zone.
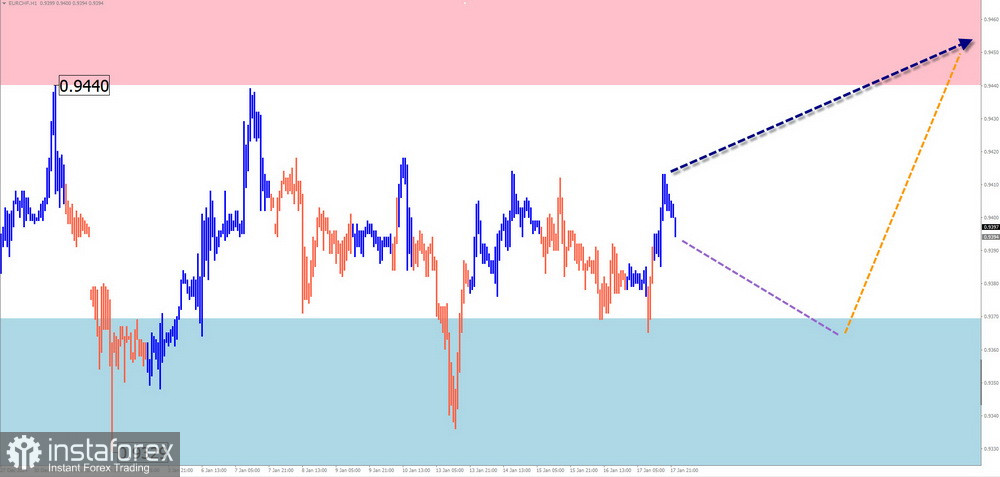
EUR/CHF

Analysis:Since late November, EUR/CHF has been trending upward. The latest, incomplete wave segment is downward, serving as a correction within the broader uptrend.

Forecast:In the next few days, expect sideways movement or a brief dip, but not below the calculated support. A continuation of the upward move is more likely by the end of the week. The calculated resistance aligns with the lower boundary of the preliminary target zone.

This image is no longer relevant

Potential Reversal Zones:

  • Resistance: 0.9440–0.9490
  • Support: 0.9370–0.9320

Recommendations:

  • Sell: High risk and may result in losses.
  • Buy: Consider trades after confirmed reversal signals in the support zone.
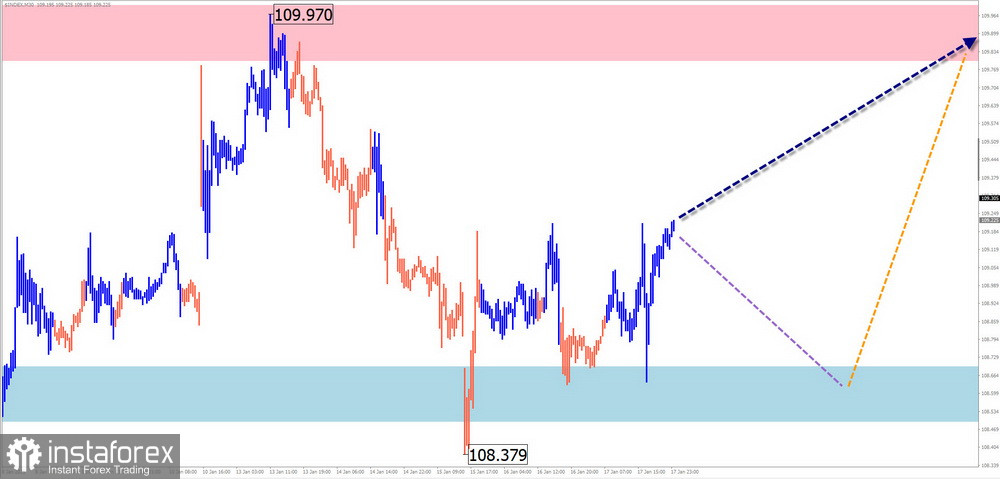
US Dollar Index

Analysis:After a period of steady growth, the USD Index is undergoing a correction. The wave began at the start of the year and remains incomplete, forming a shifting flat structure. The preliminary target zone aligns with a significant support level on the largest timeframe.

Forecast:Early in the week, expect sideways movement along the support zone. Increased volatility, a reversal, and a resumption of the dollar's uptrend are likely by the week's end.

This image is no longer relevant

Potential Reversal Zones:

  • Resistance: 109.80–110.00
  • Support: 108.70–108.50

Recommendations:

  • Sell: Risky, with limited potential for dollar weakening.
  • Buy: Weakness in major currency pairs against the dollar offers profitable opportunities.

Notes on Simplified Wave Analysis (SWA):

  • All waves in SWA consist of three parts (A-B-C). The analysis focuses on the last, incomplete wave on each timeframe.
  • Dotted lines indicate expected movements.
  • Caution: Wave algorithms do not account for the duration of price movements over time.
Isabel Clark,
Analytical expert of InstaForex
© 2007-2025
GBPUSD
Great Britain Pound vs US Dollar
Summary
Neutral
Urgency
1 week
Analytic
Vyacheslav Ognev
Start trade
Earn on cryptocurrency rate changes with InstaForex
Download MetaTrader 4 and open your first trade
  • Grand Choice
    Contest by
    InstaForex
    InstaForex always strives to help you
    fulfill your biggest dreams.
    JOIN CONTEST

Recommended Stories

EUR/USD Analysis on May 21, 2025

The wave pattern on the 4-hour chart for EUR/USD has transformed into a bullish structure and continues to remain so. I believe no one doubts that this transformation occurred solely

Chin Zhao 18:56 2025-05-21 UTC+2

GBP/USD Analysis on May 21, 2025

wave structure, largely driven by Donald Trump. The wave setup is nearly identical to that of EUR/USD. Until February 28, we observed the formation of a convincing corrective structure that

Chin Zhao 18:51 2025-05-21 UTC+2

GBP/USD Analysis on May 20, 2025

The wave pattern for GBP/USD continues to indicate the formation of a bullish impulsive wave structure, thanks to Donald Trump. The wave picture is almost identical to that

Chin Zhao 19:47 2025-05-20 UTC+2

EUR/USD Analysis on May 20, 2025

The wave structure on the 4-hour EUR/USD chart has transformed into a bullish one and continues to maintain that shape. I believe there is no doubt that this transformation occurred

Chin Zhao 19:40 2025-05-20 UTC+2

EUR/USD Analysis on May 19, 2025

The wave pattern on the 4-hour chart has transformed into a bullish structure and remains as such. I believe there is no doubt that this transformation occurred solely

Chin Zhao 18:26 2025-05-19 UTC+2

Weekly Forecast Using Simplified Wave Analysis for GBP/USD, AUD/USD, USD/CHF, EUR/JPY, EUR/GBP, and the US Dollar Index on May 19th

GBP/USD Analysis: Since April 8, GBP/USD has been moving upward on the price chart. From the lower boundary of the potential reversal zone, a counter-correction has been forming

Isabel Clark 11:43 2025-05-19 UTC+2

Weekly Forecast Using Simplified Wave Analysis for EUR/USD, USD/JPY, GBP/JPY, USD/CAD, NZD/USD, and Gold on May 19th

EUR/USD Analysis: Since February, the EUR/USD chart has been forming an upward wave. Over the past month and a half, a corrective segment (B) has been developing within this wave

Isabel Clark 11:40 2025-05-19 UTC+2

GBP/USD Analysis on May 16, 2025

The wave structure for the GBP/USD instrument continues to indicate the formation of a bullish impulsive wave sequence. "Thanks" to Donald Trump, the wave pattern closely mirrors that of EUR/USD

Chin Zhao 18:43 2025-05-16 UTC+2

EUR/USD Analysis on May 16, 2025

The wave structure on the 4-hour chart for the EUR/USD pair has transformed into an upward one and continues to hold this formation. I believe there is little doubt that

Chin Zhao 18:40 2025-05-16 UTC+2

EUR/USD Analysis on May 15, 2025

The wave pattern on the 4-hour chart for EUR/USD has shifted into a bullish formation and remains so. There is little doubt that this transformation has occurred solely

Chin Zhao 19:26 2025-05-15 UTC+2
Can't speak right now?
Ask your question in the chat.
Widget callback
 

Dear visitor,

Your IP address shows that you are currently located in the USA. If you are a resident of the United States, you are prohibited from using the services of InstaFintech Group including online trading, online transfers, deposit/withdrawal of funds, etc.

If you think you are seeing this message by mistake and your location is not the US, kindly proceed to the website. Otherwise, you must leave the website in order to comply with government restrictions.

Why does your IP address show your location as the USA?

  • - you are using a VPN provided by a hosting company based in the United States;
  • - your IP does not have proper WHOIS records;
  • - an error occurred in the WHOIS geolocation database.

Please confirm whether you are a US resident or not by clicking the relevant button below. If you choose the wrong option, being a US resident, you will not be able to open an account with InstaForex anyway.

We are sorry for any inconvenience caused by this message.