GBP/USD 5-Minute Analysis
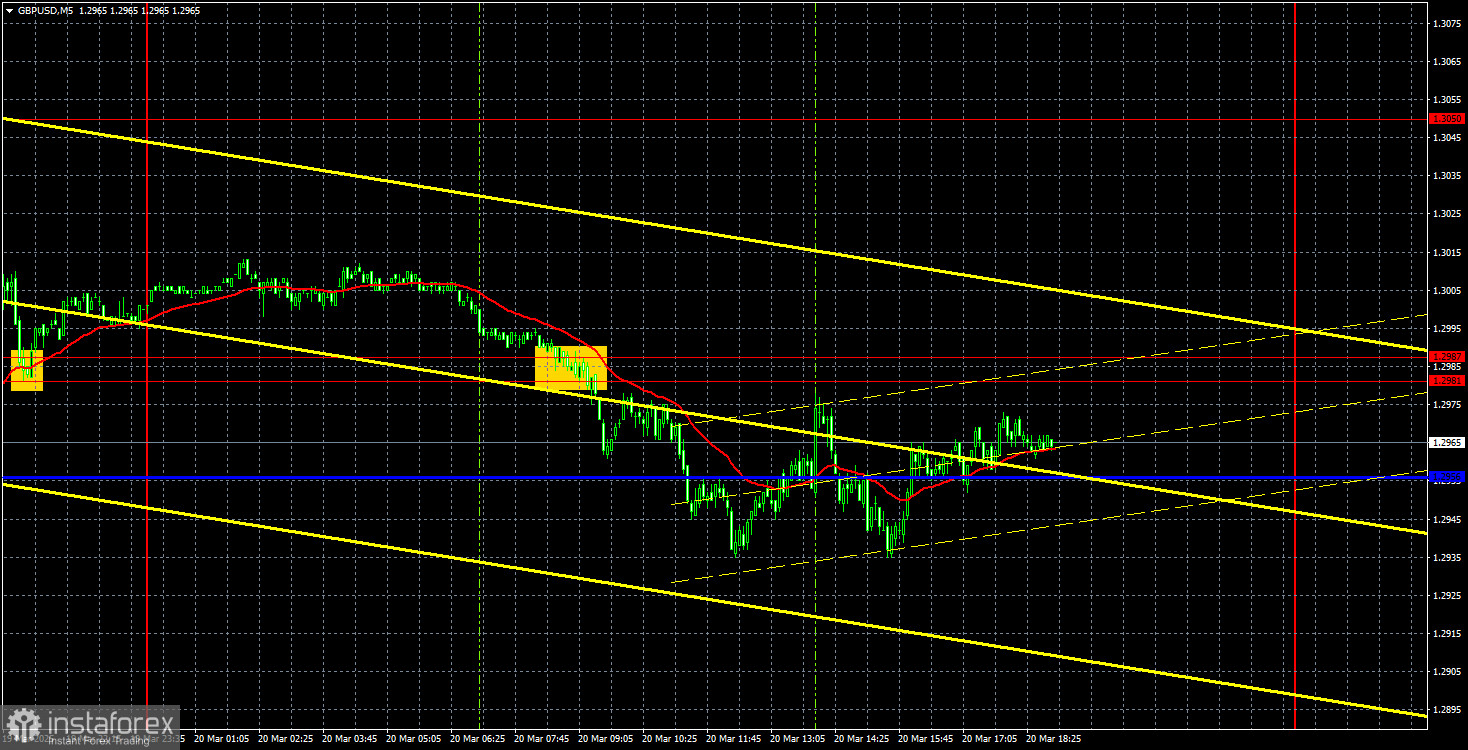
The GBP/USD currency pair continued trading on Thursday... It's hard to say which direction to go in. The uptrend remains intact, but the price broke below the lower boundary of the ascending channel yesterday. Over the last few days, we've seen choppy, indecisive moves—"zigzags" and "fences." Volatility has dropped below average. It seems like the market doesn't know what to do next: traders don't want to buy the dollar but have no strength to buy the pound.
Let's recall that the British pound has done absolutely nothing to justify a strong, confident rally. The UK has released a few decent reports in recent weeks, but how many poor ones were there over the same period? And all this time, GBP/USD has only gone up. Then, on Wednesday evening, the Federal Reserve took a relatively hawkish stance, but the dollar fell anyway. The next day, the Bank of England also adopted a hawkish tone — and this time, the pound fell.
Looking at the fundamentals, things don't look any better. The market remains fixated on Donald Trump's tariff agenda, which could lead to a recession. And even Jerome Powell's comments on Wednesday evening, assuring that the U.S. economy is not at risk of recession, changed nothing.
The only trade signal on Thursday worth noting was the breakthrough of the 1.2981–1.2987 zone. After that, things descended into a chaotic mess — all amid minimal volatility. The BoE failed to spark any meaningful price movement, not even a one-sided push. GBP/USD is currently exhibiting complete disorder and chaos. There's no way to describe the recent moves as logical or consistent.
COT Report
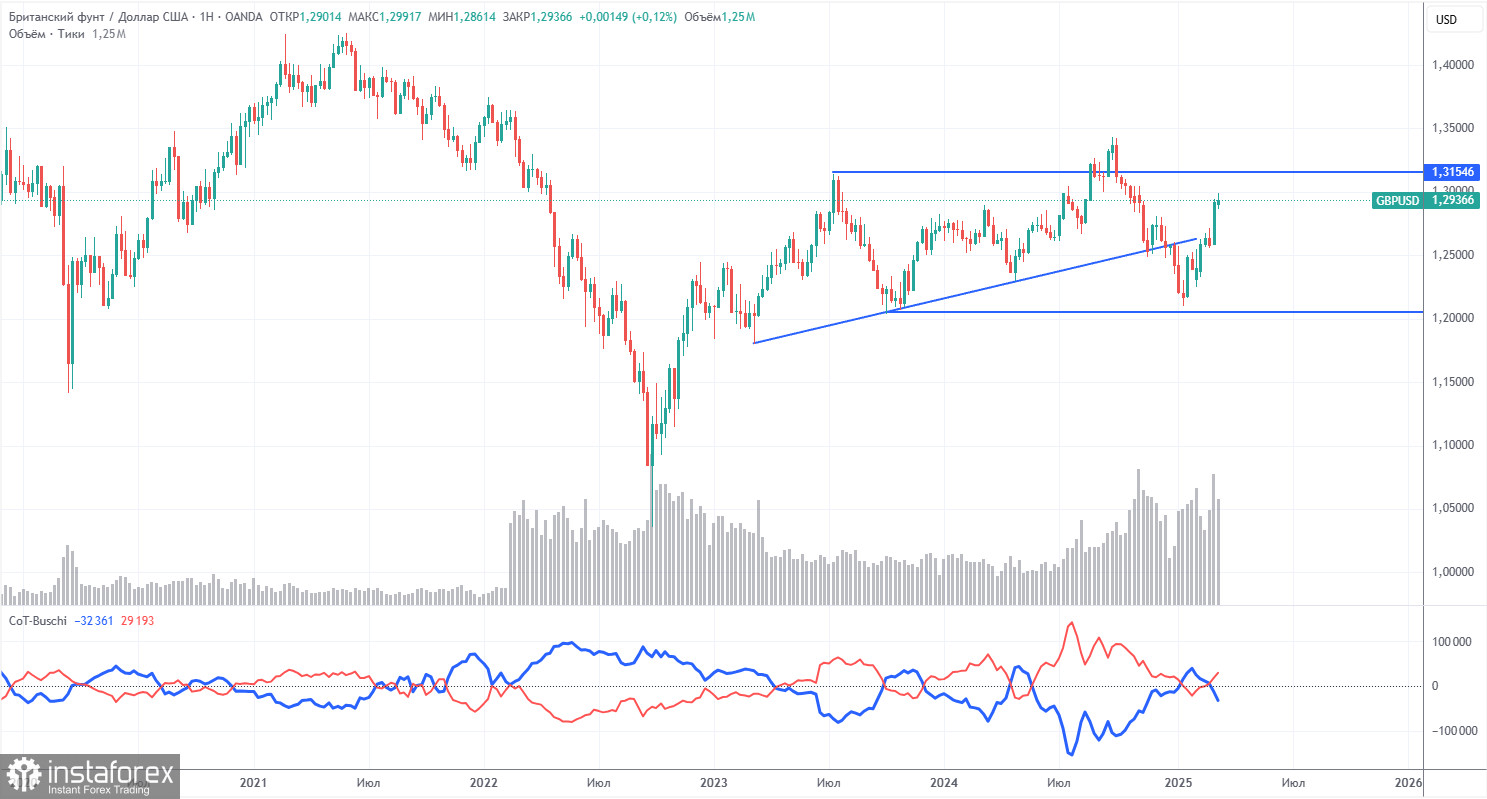
COT reports on the British pound indicate that sentiment among commercial traders has been fluctuating over recent years. The red and blue lines, which represent the net positions of commercial and non-commercial traders, frequently intersect and typically hover around the zero mark. Currently, they are close to each other, suggesting a roughly equal number of buy and sell positions.
On the weekly timeframe, the price initially broke through the 1.3154 level before dropping to the trend line, which it subsequently breached. This break suggests that the pound is likely to continue its decline. However, there was also a rebound from the second-to-last local low on the weekly chart, indicating that the market might be entering a period of sideways movement.
According to the latest report on the British pound, the non-commercial group opened 12,900 BUY contracts and 2,300 SELL contracts. Consequently, the net position of non-commercial traders increased by 10,600 contracts over the week.
The fundamental background still does not provide justification for long-term purchases of the British pound. The currency may continue its global downward trend. While the pound has risen significantly in recent times, this increase can be attributed largely to Donald Trump's policies.
GBP/USD 1-Hour Analysis
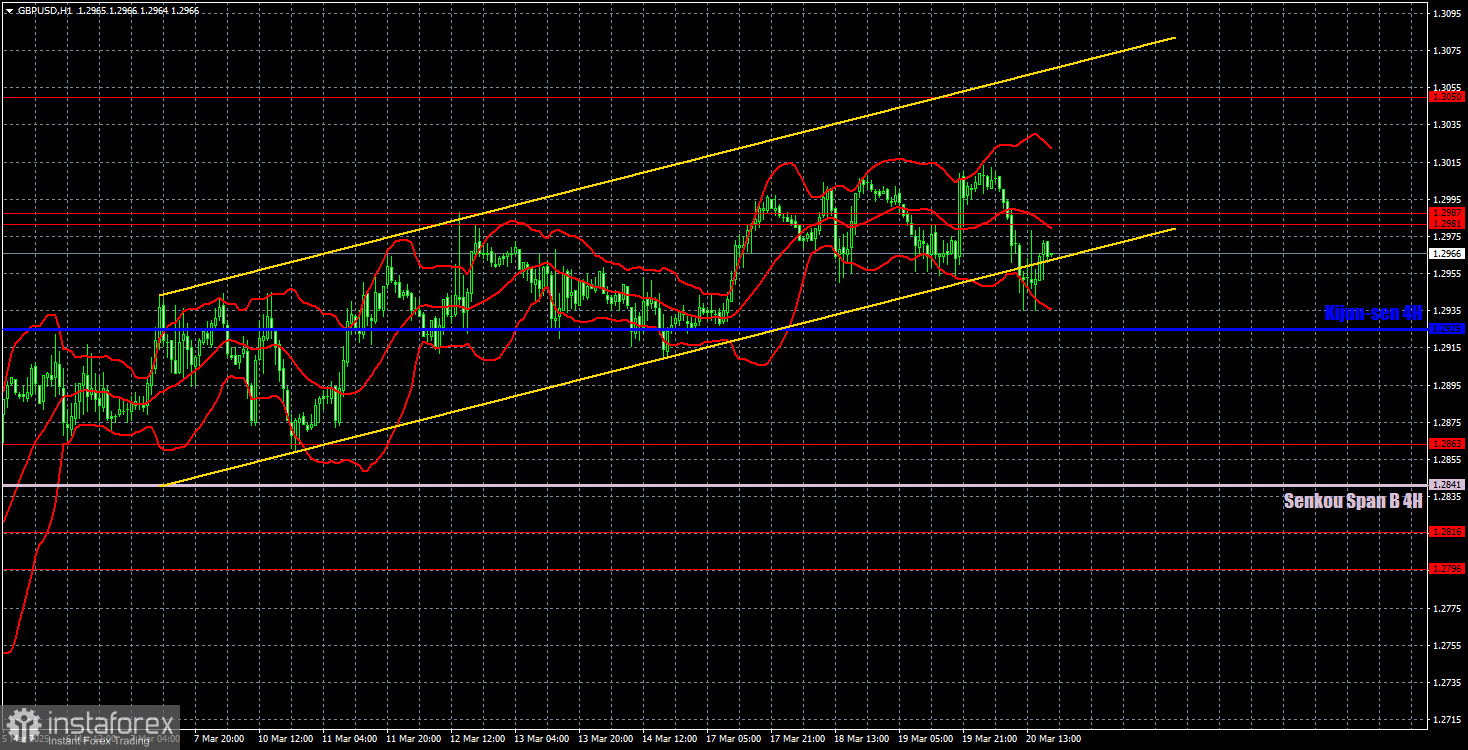
On the hourly chart, the GBP/USD pair still shows an upward trend, but trading in a sideways range generates false technical signals and seems directionless. The upward correction on the daily timeframe should have ended a while ago. We still don't see why the British pound should continue rising in the long term. The only thing supporting the pound right now is Donald Trump's stream of sanctions and tariffs. But even when no new sanctions are announced, the dollar still weakens—or at least doesn't grow. The market is ignoring all other factors.
Key trading levels for March 21: 1.2331–1.2349, 1.2429–1.2445, 1.2511, 1.2605–1.2620, 1.2691–1.2701, 1.2796–1.2816, 1.2863, 1.2981–1.2987, 1.3050, 1.3119. Also, watch the Senkou Span B (1.2841) and Kijun-sen (1.2925) lines, which can serve as signal sources. Setting the Stop Loss to breakeven after a 20-pip move in the correct direction is recommended. The Ichimoku indicator lines may shift during the day, which should be factored into signal analysis.
No significant events are scheduled in the UK or the U.S. on Friday, probably for the better. Predicting GBP/USD movements even a few hours ahead is nearly impossible. The market reacts to macro and fundamental data however it pleases—or sometimes not at all.
Illustration Explanations:
- Support and Resistance Levels (thick red lines): Thick red lines indicate where movement may come to an end. Please note that these lines are not sources of trading signals.
- Kijun-sen and Senkou Span B Lines: Ichimoku indicator lines transferred from the 4-hour timeframe to the hourly timeframe. These are strong lines.
- Extreme Levels (thin red lines): Thin red lines where the price has previously bounced. These serve as sources of trading signals.
- Yellow Lines: Trendlines, trend channels, or any other technical patterns.
- Indicator 1 on COT Charts: Represents the net position size for each category of traders.