empty
21.04.2025 04:01 AM
Trading Recommendations and Analysis for EUR/USD on April 21: Easter and Flat Market

EUR/USD 5-Minute Analysis

This image is no longer relevant

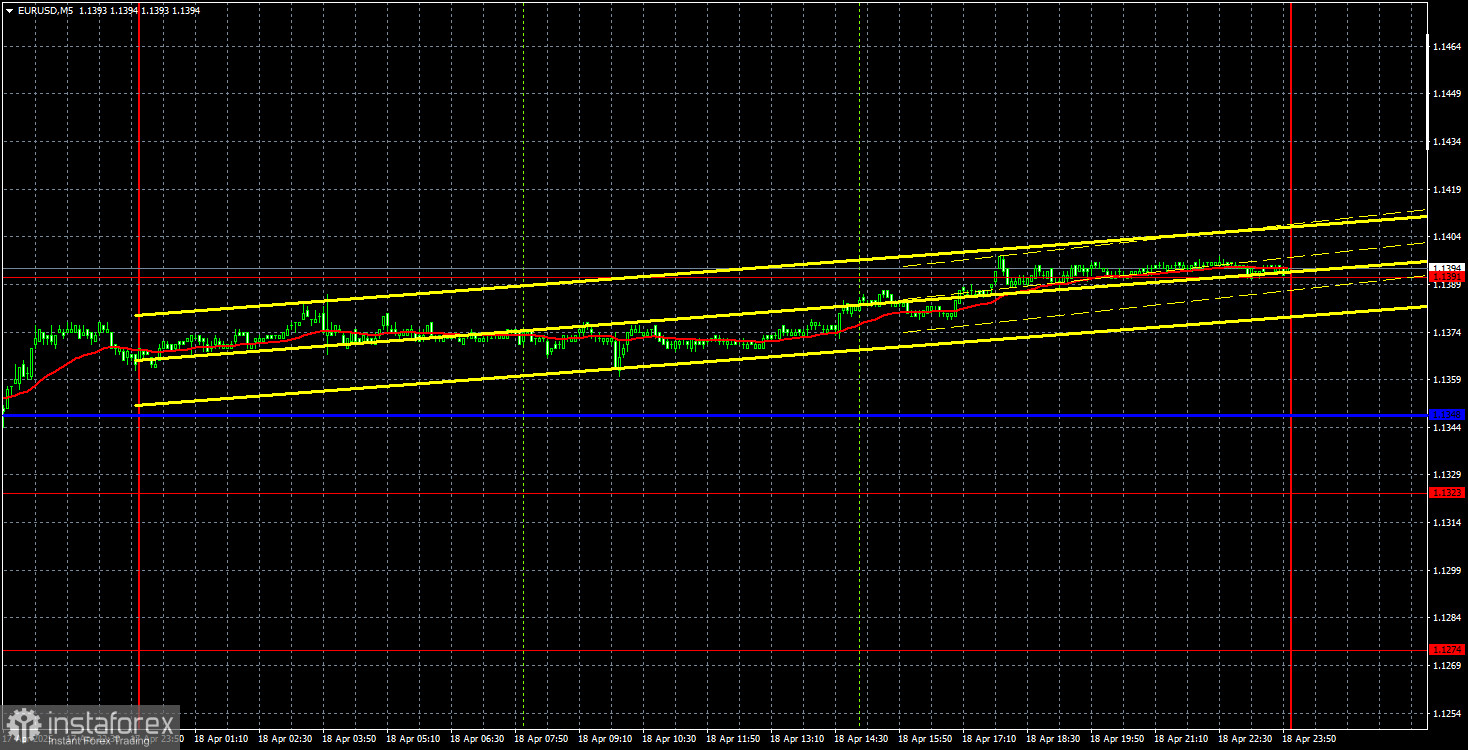
On Friday, the EUR/USD currency pair essentially remained flat. By the end of the day, the euro had gained around 20 pips, but overall volatility was practically zero all day. Good Friday and Easter had a noticeable impact. It's also worth noting that Donald Trump did not introduce any new tariffs or sanctions last week. As we can see on the hourly timeframe, the price has been moving sideways for over a week. So, no new tariffs – no reason to trade the pair. That's the logic most traders are following right now.

Given the clearly defined flat on the euro, trading is currently only possible from the boundaries of this range—or by waiting for it to end. However, as we've mentioned in our fundamental articles, the issue is that price can shoot in either direction at any moment, as it depends solely on Trump's actions. He could introduce new tariffs, revoke old ones—anything. Don't assume that dollar growth is now impossible. Usually, when the market believes a move is unlikely, that's exactly what ends up happening.

No trade signals were formed on Friday in the 5-minute timeframe. Only by the end of the day did the price reach the 1.1391 level, but there was no point in opening trades ahead of the weekend. Moreover, no valid signals were formed.

COT Report

This image is no longer relevant

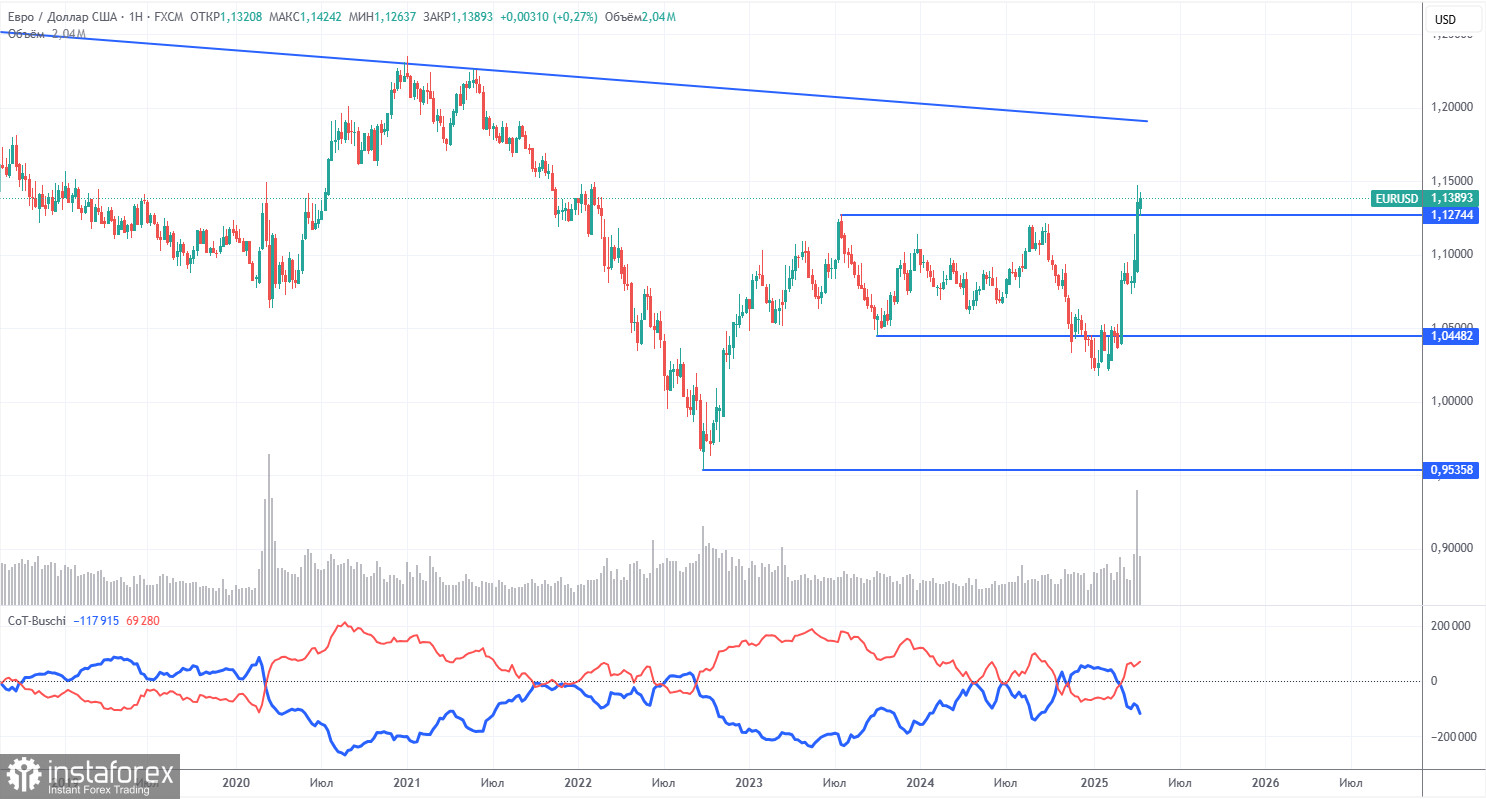
The latest COT report is dated April 15. The chart above clearly shows that the net position of non-commercial traders had long remained bullish. Bears barely managed to gain the upper hand but quickly lost it again. The bears' advantage has visibly diminished since Trump took office, and the dollar sharply declined. We cannot definitively say that the decline of the U.S. currency will continue, but COT reports reflect the sentiment of large players—which can change rapidly under the current circumstances.

We still see no fundamental factors justifying euro strength, but one significant factor is now driving dollar weakness. The pair may continue to correct for several more weeks or months, but a 16-year downtrend won't reverse so easily.

The red and blue lines have now crossed again, signaling a bullish trend in the market. During the latest reporting week, the "Non-commercial" group increased its long positions by 6,800 and reduced its short positions by 2,500, resulting in a net increase of 9,300 contracts.

EUR/USD 1-Hour Analysis

This image is no longer relevant

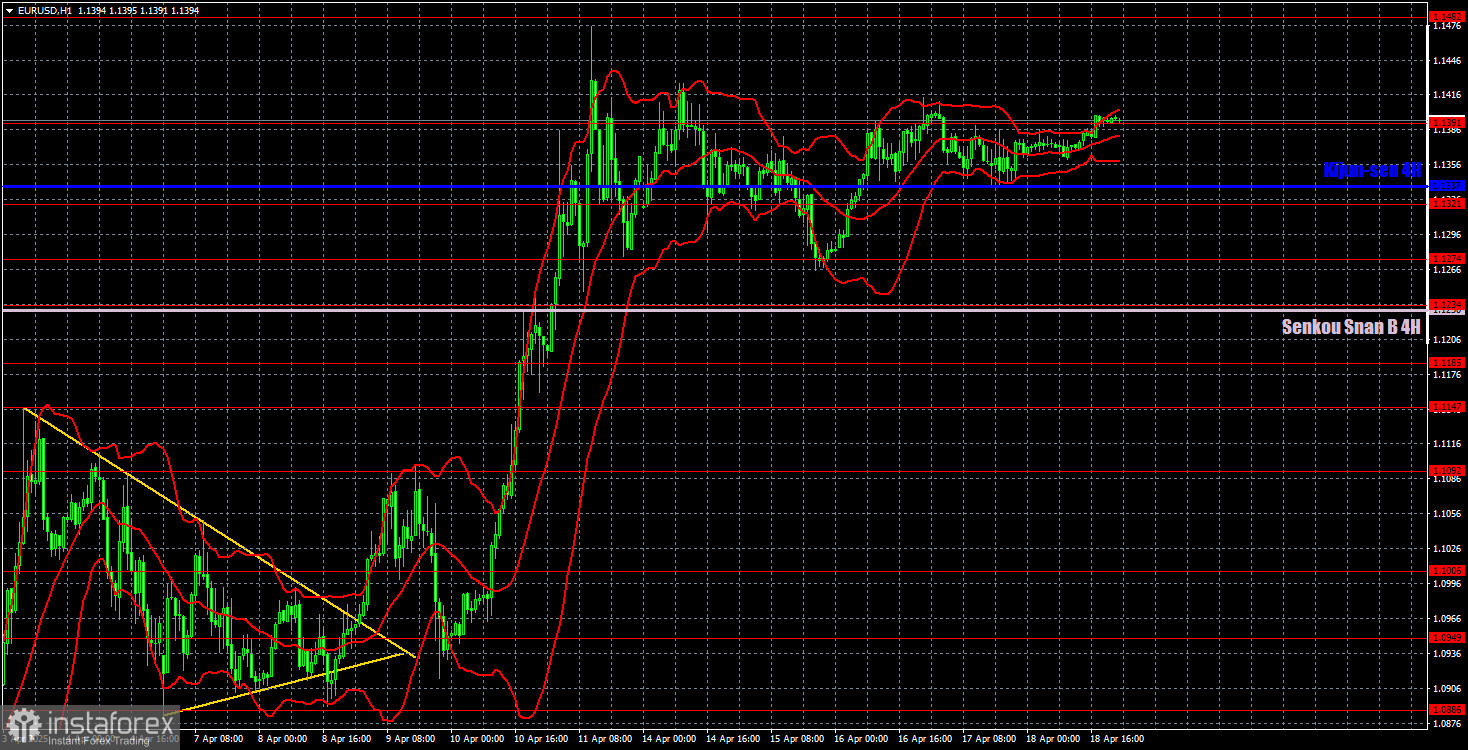
The EUR/USD pair quickly resumed its upward movement on the hourly timeframe once Trump started introducing new tariffs. The price is moving sideways, and we await Trump's subsequent actions. On the daily timeframe, the downtrend has officially been broken. This never would have happened without Trump initiating a trade war. As a result, the fundamental background has overridden the technical picture—which is rare but does happen. Unfortunately, the uptrend could end just as abruptly if Trump stops imposing tariffs and takes steps toward de-escalation.

Key levels for trading on April 21 include: 1.0757, 1.0797, 1.0823, 1.0886, 1.0949, 1.1006, 1.1092, 1.1147, 1.1185, 1.1234, 1.1274, 1.1323, 1.1391, 1.1482, as well as the Senkou Span B line (1.1230) and the Kijun-sen line (1.1337). Ichimoku indicator lines can move during the day, so keep that in mind when identifying signals. Don't forget to set your Stop Loss to breakeven once the price moves 15 pips in the right direction. This protects against losses if the signal turns out to be false.

No crucial events or reports are scheduled for Monday, neither in the European Union nor the US. However, last week demonstrated that important events do not guarantee market movements or reactions. The market lives solely on news about the trade war.

Illustration Explanations:

  • Support and Resistance Levels (thick red lines): Thick red lines indicate where movement may come to an end. Please note that these lines are not sources of trading signals.
  • Kijun-sen and Senkou Span B Lines: Ichimoku indicator lines transferred from the 4-hour timeframe to the hourly timeframe. These are strong lines.
  • Extreme Levels (thin red lines): Thin red lines where the price has previously bounced. These serve as sources of trading signals.
  • Yellow Lines: Trendlines, trend channels, or any other technical patterns.
  • Indicator 1 on COT Charts: Represents the net position size for each category of traders.
Paolo Greco,
Analytical expert of InstaForex
© 2007-2025
Select timeframe
5
min
15
min
30
min
1
hour
4
hours
1
day
1
week
Earn on cryptocurrency rate changes with InstaForex
Download MetaTrader 4 and open your first trade
  • Grand Choice
    Contest by
    InstaForex
    InstaForex always strives to help you
    fulfill your biggest dreams.
    JOIN CONTEST

Recommended Stories

How to Trade the GBP/USD Pair on May 28? Simple Tips and Trade Analysis for Beginners

Analysis of Tuesday's Trades 1H Chart of GBP/USD On Tuesday, the GBP/USD pair also traded lower for the same reasons as the EUR/USD pair. First, after a conversation with Ursula

Paolo Greco 06:41 2025-05-28 UTC+2

How to Trade the EUR/USD Pair on May 28? Simple Tips and Trade Analysis for Beginners

Analysis of Tuesday's Trades 1H Chart of EUR/USD On Tuesday, the EUR/USD currency pair continued its downward movement, which had begun on Monday. The dollar continued to strengthen the night

Paolo Greco 06:41 2025-05-28 UTC+2

Trading Recommendations and Analysis for GBP/USD on May 28: A Minor Correction Won't Hurt

On Tuesday, the GBP/USD currency pair also traded lower for the same reasons as the EUR/USD pair. However, it cannot be said that the British currency depreciated significantly—an upward movement

Paolo Greco 04:10 2025-05-28 UTC+2

Trading Recommendations and Analysis for EUR/USD on May 28: The Dollar's Joy May Be Short-Lived

The EUR/USD currency pair showed a somewhat significant downward movement on Tuesday. However, this move did not impact the overall trend, market sentiment, or the broader context. The strengthening

Paolo Greco 04:10 2025-05-28 UTC+2

GBP/USD: Trading Plan for the U.S. Session on May 27th (Review of Morning Trades)

In my morning forecast, I highlighted the 1.3545 level and planned to make trading decisions based on it. Let's look at the 5-minute chart and see what happened. A decline

Miroslaw Bawulski 20:13 2025-05-27 UTC+2

EUR/USD: Trading Plan for the U.S. Session on May 27th (Review of the Morning Trades)

In my morning forecast, I highlighted the 1.1374 level and planned to make trading decisions based on it. Let's look at the 5-minute chart to analyze what happened. A decline

Miroslaw Bawulski 20:07 2025-05-27 UTC+2

How to Trade the GBP/USD Pair on May 27? Simple Tips and Trade Analysis for Beginners

Analysis of Monday's Trades 1H Chart of GBP/USD On Monday, the GBP/USD pair reached 1.3580 — heights the British pound hadn't seen in over three years. As we've said

Paolo Greco 07:04 2025-05-27 UTC+2

How to Trade the EUR/USD Pair on May 27? Simple Tips and Trade Analysis for Beginners

Analysis of Monday's Trades 1H Chart of EUR/USD The EUR/USD currency pair continued its upward movement on Monday, which had started back on Friday. Only in the second half

Paolo Greco 07:04 2025-05-27 UTC+2

Trading Recommendations and Analysis for GBP/USD on May 27: No Reason to Be Upset

The GBP/USD currency pair also traded higher on Monday, although it pulled back slightly during the day. This retreat followed the announcement that the increase in tariffs for the European

Paolo Greco 05:26 2025-05-27 UTC+2

Trading Recommendations and Analysis for EUR/USD on May 27: The Market Is Starting to Get Angry

On Monday, the EUR/USD currency pair initially rose following Trump's announcement that tariffs on EU goods would increase to 50% starting June 1. However, the pair subsequently fell after Trump

Paolo Greco 05:26 2025-05-27 UTC+2
Can't speak right now?
Ask your question in the chat.
Widget callback
 

Dear visitor,

Your IP address shows that you are currently located in the USA. If you are a resident of the United States, you are prohibited from using the services of InstaFintech Group including online trading, online transfers, deposit/withdrawal of funds, etc.

If you think you are seeing this message by mistake and your location is not the US, kindly proceed to the website. Otherwise, you must leave the website in order to comply with government restrictions.

Why does your IP address show your location as the USA?

  • - you are using a VPN provided by a hosting company based in the United States;
  • - your IP does not have proper WHOIS records;
  • - an error occurred in the WHOIS geolocation database.

Please confirm whether you are a US resident or not by clicking the relevant button below. If you choose the wrong option, being a US resident, you will not be able to open an account with InstaForex anyway.

We are sorry for any inconvenience caused by this message.