empty
01.05.2025 06:38 PM
EUR/USD: Trading Plan for the U.S. Session on May 1st (Review of the Morning Trades)

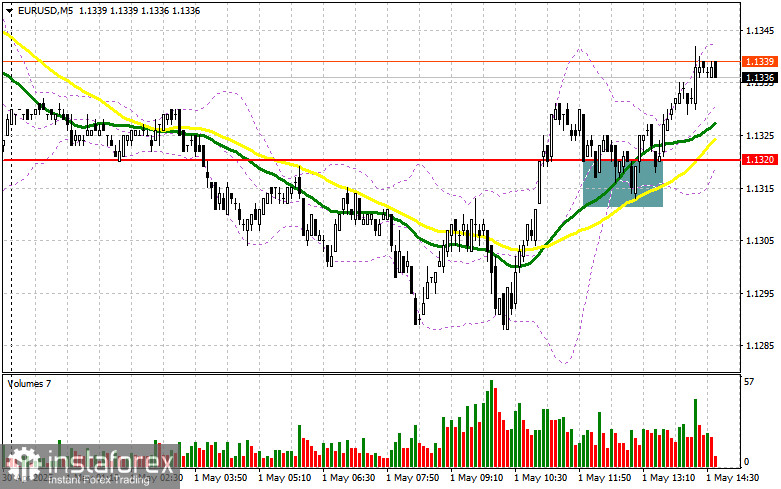
In my morning forecast, I focused on the 1.1320 level and planned to make market entry decisions based on it. Let's take a look at the 5-minute chart and see what happened. A decline followed by a false breakout around the 1.1320 level led to a good entry point for buying the euro, resulting in a 20-point rise in the pair. The technical picture was revised for the second half of the day.

This image is no longer relevant

To open long positions on EUR/USD:

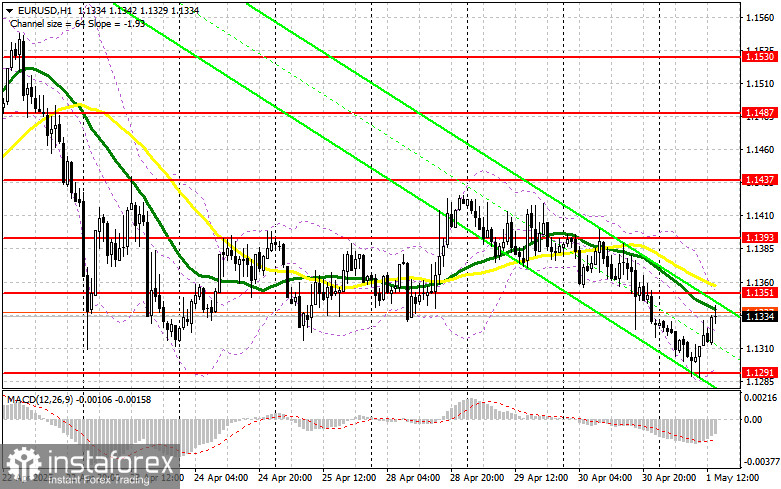
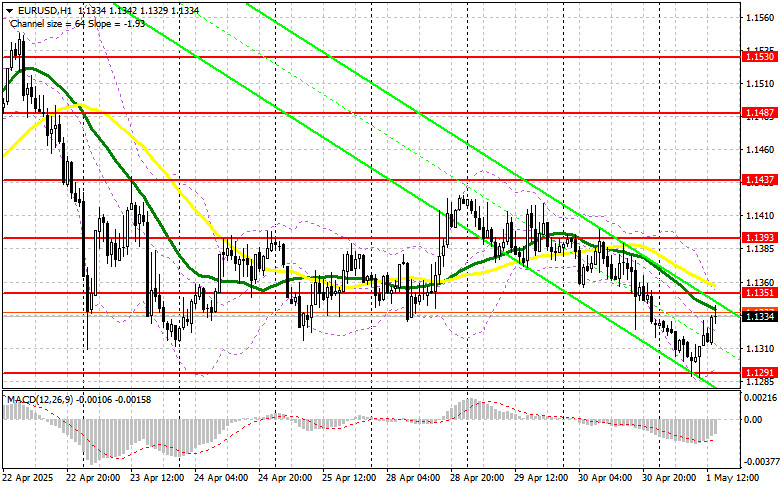
The second half of the day may be dominated by sellers, as we are expecting another round of important U.S. statistics. It will start with weekly data on initial jobless claims and end with the ISM Manufacturing Index for April. It's hard to predict how the market will react, but strong data could bring renewed pressure on the euro, leading to a new wave of EUR/USD declines — which I plan to capitalize on. I intend to act from a more significant support level at 1.1291, established in the first half of the day. A false breakout there will serve as a reason to buy EUR/USD in anticipation of a market rebound toward 1.1351. A breakout and retest of this range from above will confirm the right entry point for further growth toward the 1.1393 area. The furthest target will be 1.1437, where I plan to take profit. If EUR/USD drops and there's no activity around 1.1291, pressure on the pair will increase significantly, potentially leading to a sharper downward move. In that case, bears could reach 1.1250. Only after a false breakout form will I consider buying the euro. Otherwise, I plan to open long positions on a rebound from 1.1209, targeting a 30–35 point intraday correction.

To open short positions on EUR/USD:

If the euro rises on the back of weak U.S. data — which is also possible — bears will need to prove their presence around 1.1351. Only a false breakout there will be a reason to enter short positions against the trend, aiming for a drop to 1.1291 support. A breakout and consolidation below this range would be an ideal selling scenario with a move toward 1.1250. The furthest target will be the 1.1209 area, where I plan to take profit. A test of this level would break the bullish market structure. If EUR/USD continues rising in the second half of the day and bears fail to act at 1.1351 — where the moving averages currently align in favor of the bears — buyers may push for a breakout toward 1.1393. I will only sell there after a failed consolidation. Alternatively, I plan to open short positions on a rebound from 1.1393 targeting a 30–35 point downward correction.

This image is no longer relevant

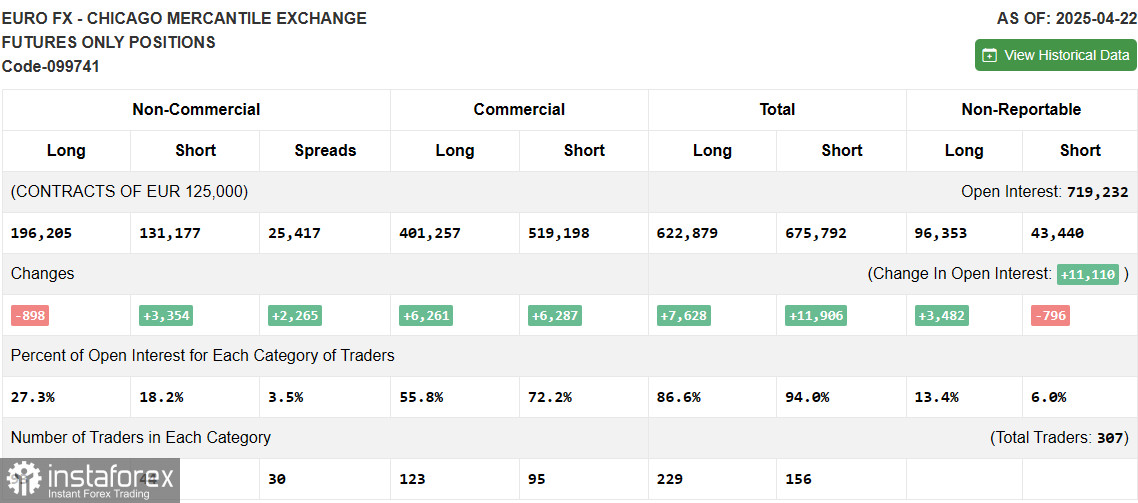
The COT (Commitment of Traders) report from April 22 showed an increase in short positions and a decrease in long ones. Given that the European Central Bank is practically openly signaling further rate cuts, this is currently preventing the euro from continuing its growth against the U.S. dollar. Loosening trade tensions from Donald Trump and a potential compromise with China are slowly bringing U.S. dollar buyers back to the market. In the near term, the most decisive factors will be U.S. Q1 economic growth figures and April labor market data. The COT report showed that long non-commercial positions fell by 898 to 196,205, while short non-commercial positions rose by 3,354 to 131,177. As a result, the gap between long and short positions narrowed by 2,493.

This image is no longer relevant

Indicator Signals:

Moving Averages Trading is occurring below the 30- and 50-day moving averages, which indicates further downside for the pair.

Note: The period and prices for the moving averages are based on the H1 chart and differ from the classic daily moving averages on the D1 chart.

Bollinger Bands In case of a decline, the lower boundary of the indicator around 1.1378 will act as support.

Indicator Descriptions: • Moving Average – smooths out price volatility and noise to identify the current trend. Period: 50 (marked in yellow on the chart); • Moving Average – another trend-smoothing indicator. Period: 30 (marked in green on the chart); • MACD Indicator (Moving Average Convergence/Divergence) – Fast EMA: period 12; Slow EMA: period 26; SMA: period 9; • Bollinger Bands – volatility bands based on a 20-period moving average; • Non-commercial traders – speculators such as individual traders, hedge funds, and large institutions who use the futures market for speculative purposes and meet specific requirements; • Long non-commercial positions – total long open positions of non-commercial traders; • Short non-commercial positions – total short open positions of non-commercial traders; • Net non-commercial position – the difference between non-commercial short and long positions.

Miroslaw Bawulski,
Analytical expert of InstaForex
© 2007-2025
EURUSD
Euro vs US Dollar
Summary
Sell
Urgency
1 day
Analytic
Maxim Magdalinin
Start trade
Earn on cryptocurrency rate changes with InstaForex
Download MetaTrader 4 and open your first trade
  • Grand Choice
    Contest by
    InstaForex
    InstaForex always strives to help you
    fulfill your biggest dreams.
    JOIN CONTEST

Recommended Stories

GBP/USD: Trading Plan for the U.S. Session on May 27th (Review of Morning Trades)

In my morning forecast, I highlighted the 1.3545 level and planned to make trading decisions based on it. Let's look at the 5-minute chart and see what happened. A decline

Miroslaw Bawulski 20:13 2025-05-27 UTC+2

EUR/USD: Trading Plan for the U.S. Session on May 27th (Review of the Morning Trades)

In my morning forecast, I highlighted the 1.1374 level and planned to make trading decisions based on it. Let's look at the 5-minute chart to analyze what happened. A decline

Miroslaw Bawulski 20:07 2025-05-27 UTC+2

How to Trade the GBP/USD Pair on May 27? Simple Tips and Trade Analysis for Beginners

Analysis of Monday's Trades 1H Chart of GBP/USD On Monday, the GBP/USD pair reached 1.3580 — heights the British pound hadn't seen in over three years. As we've said

Paolo Greco 07:04 2025-05-27 UTC+2

How to Trade the EUR/USD Pair on May 27? Simple Tips and Trade Analysis for Beginners

Analysis of Monday's Trades 1H Chart of EUR/USD The EUR/USD currency pair continued its upward movement on Monday, which had started back on Friday. Only in the second half

Paolo Greco 07:04 2025-05-27 UTC+2

Trading Recommendations and Analysis for GBP/USD on May 27: No Reason to Be Upset

The GBP/USD currency pair also traded higher on Monday, although it pulled back slightly during the day. This retreat followed the announcement that the increase in tariffs for the European

Paolo Greco 05:26 2025-05-27 UTC+2

Trading Recommendations and Analysis for EUR/USD on May 27: The Market Is Starting to Get Angry

On Monday, the EUR/USD currency pair initially rose following Trump's announcement that tariffs on EU goods would increase to 50% starting June 1. However, the pair subsequently fell after Trump

Paolo Greco 05:26 2025-05-27 UTC+2

GBP/USD: Trading Plan for the U.S. Session on May 26th (Review of Morning Trades)

In my morning forecast, I focused on the 1.3570 level and planned to make entry decisions around it. Let's look at the 5-minute chart and analyze what happened. A decline

Miroslaw Bawulski 15:03 2025-05-26 UTC+2

EUR/USD: Trading Plan for the U.S. Session on May 26th (Review of Morning Trades)

In my morning forecast, I focused on the 1.1416 level as a key area for making trading decisions. Let's look at the 5-minute chart and break down what happened. After

Miroslaw Bawulski 14:59 2025-05-26 UTC+2

How to Trade the GBP/USD Pair on May 26? Simple Tips and Trade Analysis for Beginners

Analysis of Friday's Trades 1H Chart of GBP/USD The GBP/USD pair also showed a confident upward movement on Friday, driven by the overall uptrend observed over the past two weeks

Paolo Greco 07:57 2025-05-26 UTC+2

How to Trade the EUR/USD Pair on May 26? Simple Tips and Trade Analysis for Beginners

Analysis of Friday's Trades 1H Chart of EUR/USD On Friday, the EUR/USD currency pair continued its upward movement after bouncing from the 1.1267 level during a brief correction. The uptrend

Paolo Greco 07:57 2025-05-26 UTC+2
Can't speak right now?
Ask your question in the chat.
Widget callback
 

Dear visitor,

Your IP address shows that you are currently located in the USA. If you are a resident of the United States, you are prohibited from using the services of InstaFintech Group including online trading, online transfers, deposit/withdrawal of funds, etc.

If you think you are seeing this message by mistake and your location is not the US, kindly proceed to the website. Otherwise, you must leave the website in order to comply with government restrictions.

Why does your IP address show your location as the USA?

  • - you are using a VPN provided by a hosting company based in the United States;
  • - your IP does not have proper WHOIS records;
  • - an error occurred in the WHOIS geolocation database.

Please confirm whether you are a US resident or not by clicking the relevant button below. If you choose the wrong option, being a US resident, you will not be able to open an account with InstaForex anyway.

We are sorry for any inconvenience caused by this message.