empty
13.05.2025 05:08 AM
Trading Recommendations and Analysis for GBP/USD on May 13: A Sudden Turn

GBP/USD 5-Minute Analysis

This image is no longer relevant

On Monday, the GBP/USD currency pair experienced a significant decline, which was driven by progress in negotiations between China and the United States. The logic here is strikingly simple: if the dollar plunged on news of escalating trade conflicts and the introduction of new tariffs, it should strengthen on news of easing global trade tensions. That's precisely what happened on Monday.

To recap, the U.S. and China agreed to lower tariffs by 115% for the next 90 days, during which additional negotiations will likely take place to finalize a comprehensive trade deal. As a result, trade tensions between the two nations may ease further over time. If the U.S. also reaches an agreement with the European Union in the near future, we could expect the GBP/USD pair to move toward 1.2400, the level from which the dollar began its three-month decline. At this point, the greenback's rally appears entirely logical.

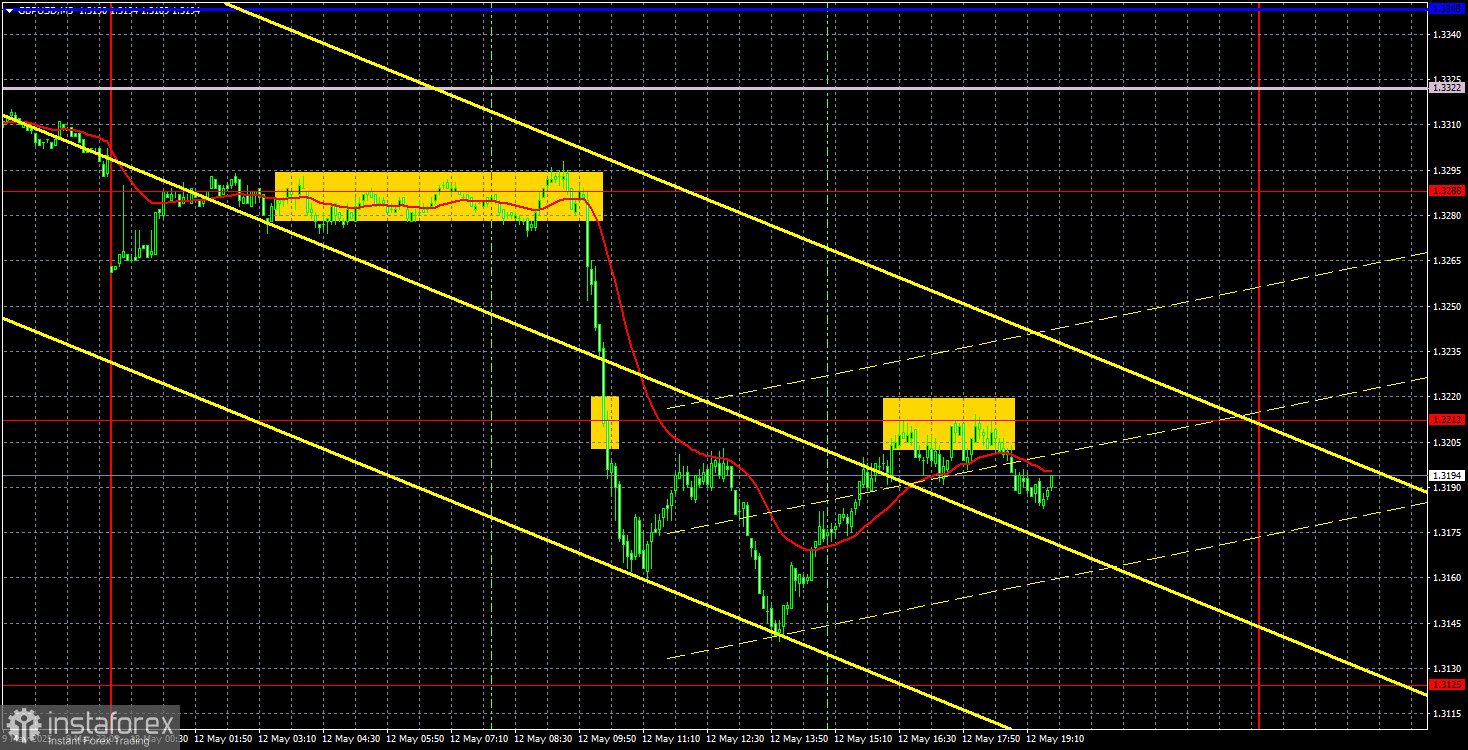
From a technical perspective, there's not much to add. Three months ago, Trump broke the downtrend, and now he could just as easily break the uptrend. We believe the U.S. dollar's growth may continue for several more days. In the 5-minute timeframe, an excellent sell signal formed near the 1.3288 level, followed by two more sell signals at around 1.3212. Thus, traders had three separate opportunities to enter short positions—each of which proved profitable.

COT Report

This image is no longer relevant

COT reports for the British pound show that commercial traders' sentiment has fluctuated frequently in recent years. The red and blue lines, representing net positions of commercial and non-commercial traders, cross regularly and typically remain near the zero line. They are again close to each other, indicating roughly equal numbers of long and short positions.

In the weekly timeframe, the price broke below the 1.3154 level, then broke a trend line, returned to 1.3154, and broke again. Breaking the trend line indicates a high probability that the pound will continue to fall. However, we see that the dollar keeps dropping due to Donald Trump. Therefore, the trade war news could continue pushing the pound higher despite technical factors.

According to the latest COT report on the British pound, the "Non-commercial" group opened 3,300 long contracts and closed 1,900 short contracts, increasing their net position by 5,200 contracts.

The fundamental backdrop still offers no justification for long-term purchases of the pound sterling, and the currency has real chances to resume a global downtrend. The pound has risen sharply recently, but we must remember that Donald Trump's policy is the sole reason. Once that factor is removed, the dollar may begin to strengthen.

GBP/USD 1-Hour Analysis

This image is no longer relevant

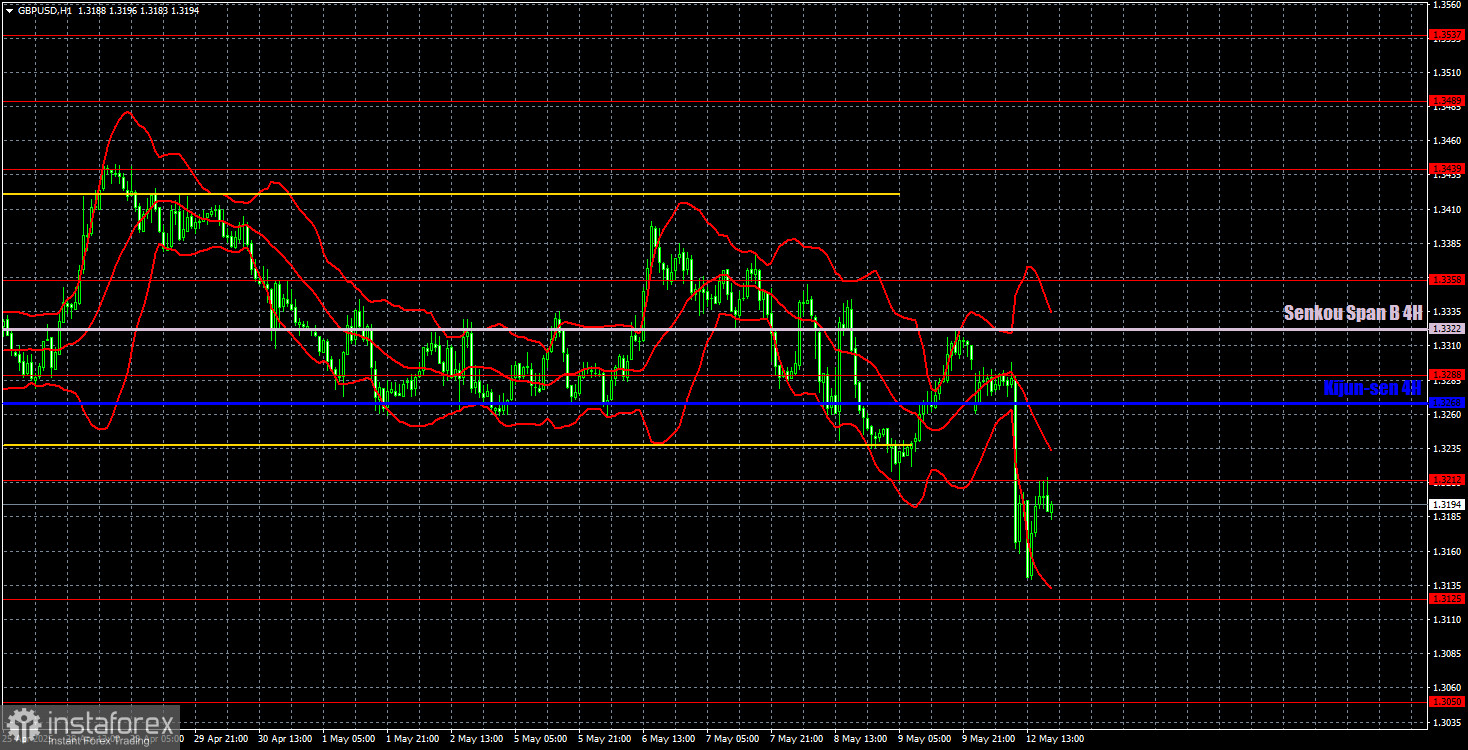
On the hourly chart, the GBP/USD pair has finally broken out of the sideways range and started a downward move. The continuation of this decline depends entirely on Donald Trump and the global trade war situation. If tensions continue to ease and more deals are signed, the dollar will likely keep strengthening. At this point, all other factors are virtually irrelevant.

For May 13, the following key levels are noted: 1.2691–1.2701, 1.2796–1.2816, 1.2863, 1.2981–1.2987, 1.3050, 1.3125, 1.3212, 1.3288, 1.3358, 1.3439, 1.3489, 1.3537. The Senkou Span B line at 1.3322 and the Kijun-sen line at 1.3268 may also serve as signal levels. A Stop Loss should be set to breakeven after the price moves 20 pips in the favorable direction. Note that the Ichimoku indicator lines may shift throughout the day and should be monitored for signal accuracy.

On Tuesday, the UK will publish reports on unemployment, jobless claims, and wages. These are quite important data that have an impact on the monetary policy of the Bank of England. In the States, the inflation report will be published, which has an impact on the Federal Reserve's monetary policy. However, none of these reports is likely to strongly impact price movements, since the trade war remains the key market driver. The more positive news we receive on that front, the more the dollar will continue to rise.

Illustration Explanations:

  • Support and resistance price levels – thick red lines where movement may end. They are not trading signal sources.
  • Kijun-sen and Senkou Span B lines—These are strong Ichimoku indicator lines transferred to the hourly timeframe from the 4-hour one.
  • Extremum levels – thin red lines where the price has previously rebounded. These act as trading signal sources.
  • Yellow lines – trend lines, trend channels, and other technical patterns.
  • COT Indicator 1 on the charts – the size of the net position for each category of traders.
Paolo Greco,
Analytical expert of InstaForex
© 2007-2025
Select timeframe
5
min
15
min
30
min
1
hour
4
hours
1
day
1
week
Earn on cryptocurrency rate changes with InstaForex
Download MetaTrader 4 and open your first trade
  • Grand Choice
    Contest by
    InstaForex
    InstaForex always strives to help you
    fulfill your biggest dreams.
    JOIN CONTEST

Recommended Stories

GBP/USD: Trading Plan for the U.S. Session on May 28th (Review of Morning Trades)

In my morning forecast, I highlighted the 1.3497 level and planned to base entry decisions on it. Let's look at the 5-minute chart and see what happened. A rise

Miroslaw Bawulski 18:31 2025-05-28 UTC+2

EUR/USD: Trading Plan for the U.S. Session on May 28th (Review of Morning Trades)

In my morning forecast, I highlighted the 1.1300 level and planned to base my entry decisions around it. Let's take a look at the 5-minute chart to see what happened

Miroslaw Bawulski 18:27 2025-05-28 UTC+2

How to Trade the GBP/USD Pair on May 28? Simple Tips and Trade Analysis for Beginners

Analysis of Tuesday's Trades 1H Chart of GBP/USD On Tuesday, the GBP/USD pair also traded lower for the same reasons as the EUR/USD pair. First, after a conversation with Ursula

Paolo Greco 06:41 2025-05-28 UTC+2

How to Trade the EUR/USD Pair on May 28? Simple Tips and Trade Analysis for Beginners

Analysis of Tuesday's Trades 1H Chart of EUR/USD On Tuesday, the EUR/USD currency pair continued its downward movement, which had begun on Monday. The dollar continued to strengthen the night

Paolo Greco 06:41 2025-05-28 UTC+2

Trading Recommendations and Analysis for GBP/USD on May 28: A Minor Correction Won't Hurt

On Tuesday, the GBP/USD currency pair also traded lower for the same reasons as the EUR/USD pair. However, it cannot be said that the British currency depreciated significantly—an upward movement

Paolo Greco 04:10 2025-05-28 UTC+2

Trading Recommendations and Analysis for EUR/USD on May 28: The Dollar's Joy May Be Short-Lived

The EUR/USD currency pair showed a somewhat significant downward movement on Tuesday. However, this move did not impact the overall trend, market sentiment, or the broader context. The strengthening

Paolo Greco 04:10 2025-05-28 UTC+2

GBP/USD: Trading Plan for the U.S. Session on May 27th (Review of Morning Trades)

In my morning forecast, I highlighted the 1.3545 level and planned to make trading decisions based on it. Let's look at the 5-minute chart and see what happened. A decline

Miroslaw Bawulski 20:13 2025-05-27 UTC+2

EUR/USD: Trading Plan for the U.S. Session on May 27th (Review of the Morning Trades)

In my morning forecast, I highlighted the 1.1374 level and planned to make trading decisions based on it. Let's look at the 5-minute chart to analyze what happened. A decline

Miroslaw Bawulski 20:07 2025-05-27 UTC+2

How to Trade the GBP/USD Pair on May 27? Simple Tips and Trade Analysis for Beginners

Analysis of Monday's Trades 1H Chart of GBP/USD On Monday, the GBP/USD pair reached 1.3580 — heights the British pound hadn't seen in over three years. As we've said

Paolo Greco 07:04 2025-05-27 UTC+2

How to Trade the EUR/USD Pair on May 27? Simple Tips and Trade Analysis for Beginners

Analysis of Monday's Trades 1H Chart of EUR/USD The EUR/USD currency pair continued its upward movement on Monday, which had started back on Friday. Only in the second half

Paolo Greco 07:04 2025-05-27 UTC+2
Can't speak right now?
Ask your question in the chat.
Widget callback
 

Dear visitor,

Your IP address shows that you are currently located in the USA. If you are a resident of the United States, you are prohibited from using the services of InstaFintech Group including online trading, online transfers, deposit/withdrawal of funds, etc.

If you think you are seeing this message by mistake and your location is not the US, kindly proceed to the website. Otherwise, you must leave the website in order to comply with government restrictions.

Why does your IP address show your location as the USA?

  • - you are using a VPN provided by a hosting company based in the United States;
  • - your IP does not have proper WHOIS records;
  • - an error occurred in the WHOIS geolocation database.

Please confirm whether you are a US resident or not by clicking the relevant button below. If you choose the wrong option, being a US resident, you will not be able to open an account with InstaForex anyway.

We are sorry for any inconvenience caused by this message.