signal strength 2 of 5

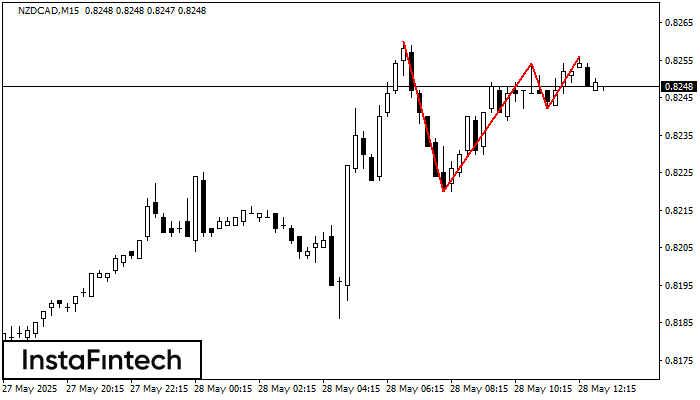
The Triple Top pattern has formed on the chart of the NZDCAD M15 trading instrument. It is a reversal pattern featuring the following characteristics: resistance level 4, support level -22, and pattern’s width 40. Forecast If the price breaks through the support level 0.8220, it is likely to move further down to 0.8231.
The M5 and M15 time frames may have more false entry points.
- All
- Double Top
- Flag
- Head and Shoulders
- Pennant
- Rectangle
- Triangle
- Triple top
- All
- #AAPL
- #AMZN
- #Bitcoin
- #EBAY
- #FB
- #GOOG
- #INTC
- #KO
- #MA
- #MCD
- #MSFT
- #NTDOY
- #PEP
- #TSLA
- #TWTR
- AUDCAD
- AUDCHF
- AUDJPY
- AUDUSD
- EURCAD
- EURCHF
- EURGBP
- EURJPY
- EURNZD
- EURRUB
- EURUSD
- GBPAUD
- GBPCHF
- GBPJPY
- GBPUSD
- GOLD
- NZDCAD
- NZDCHF
- NZDJPY
- NZDUSD
- SILVER
- USDCAD
- USDCHF
- USDJPY
- USDRUB
- All
- M5
- M15
- M30
- H1
- D1
- All
- Buy
- Sale
- All
- 1
- 2
- 3
- 4
- 5
El patrón Bandera alcista ha sido formado en NZDCAD a M15. El límite inferior del patrón está ubicado en 0.8238/0.8232, mientras que el límite superior se encuentra en 0.8246/0.8240
Los marcos de tiempo M5 y M15 pueden tener más puntos de entrada falsos.
Open chart in a new windowEl patrón gráfico Banderín alcista se ha formado en el instrumento NZDCAD M15. Este tipo de patrón entra en la categoría de patrones de continuación. En este caso
Los marcos de tiempo M5 y M15 pueden tener más puntos de entrada falsos.
Open chart in a new windowEl patrón Bandera alcista ha sido formado en AUDCAD a M15. El límite inferior del patrón está ubicado en 0.8876/0.8870, mientras que el límite superior se encuentra en 0.8882/0.8876
Los marcos de tiempo M5 y M15 pueden tener más puntos de entrada falsos.
Open chart in a new window