signal strength 2 of 5
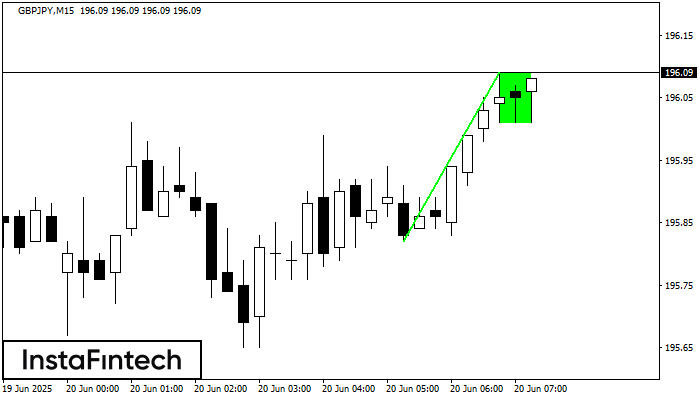
The Bullish Flag pattern has been formed on GBPJPY at M15. The lower boundary of the pattern is located at 196.01/196.01, while the higher boundary lies at 196.09/196.09. The projection of the flagpole is 27 points. This formation signals that the upward trend is most likely to continue. Therefore, if the level of 196.09 is broken, the price will move further upwards.
The M5 and M15 time frames may have more false entry points.
See Also
- All
- Double Top
- Flag
- Head and Shoulders
- Pennant
- Rectangle
- Triangle
- Triple top
- All
- #AAPL
- #AMZN
- #Bitcoin
- #EBAY
- #FB
- #GOOG
- #INTC
- #KO
- #MA
- #MCD
- #MSFT
- #NTDOY
- #PEP
- #TSLA
- #TWTR
- AUDCAD
- AUDCHF
- AUDJPY
- AUDUSD
- EURCAD
- EURCHF
- EURGBP
- EURJPY
- EURNZD
- EURRUB
- EURUSD
- GBPAUD
- GBPCHF
- GBPJPY
- GBPUSD
- GOLD
- NZDCAD
- NZDCHF
- NZDJPY
- NZDUSD
- SILVER
- USDCAD
- USDCHF
- USDJPY
- USDRUB
- All
- M5
- M15
- M30
- H1
- D1
- All
- Buy
- Sale
- All
- 1
- 2
- 3
- 4
- 5
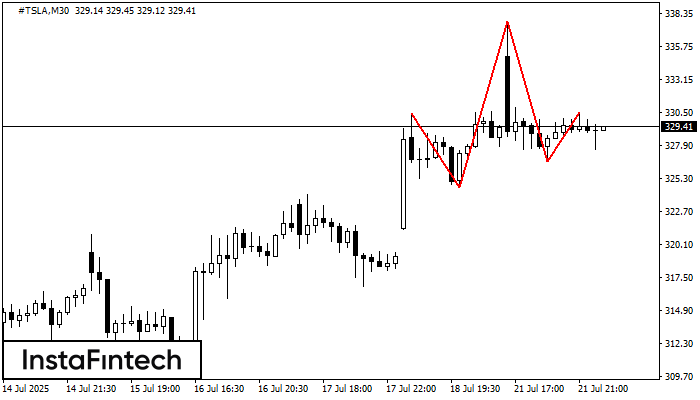
El #TSLA M30 formó el patrón Cabeza y Hombros con las siguientes características: El techo de la Cabeza se encuentra en 337.71, la línea de cuello y el ángulo alcista
Open chart in a new window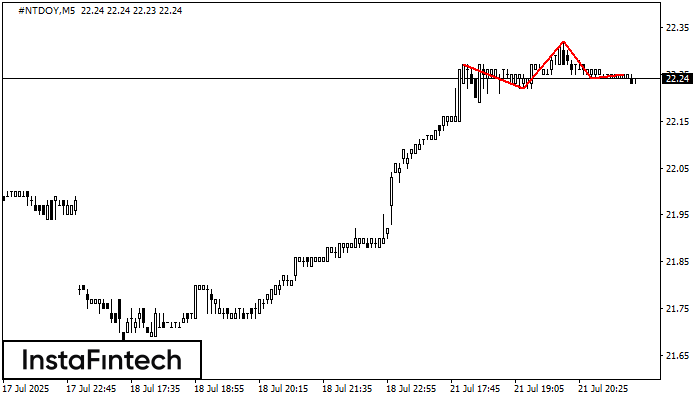
El patrón técnico llamado Cabeza y Hombros ha aparecido en el gráfico de #NTDOY M5. Existen razones poderosas para sugerir que el precio superará la línea de cuello 22.22/22.24 después
Los marcos de tiempo M5 y M15 pueden tener más puntos de entrada falsos.
Open chart in a new window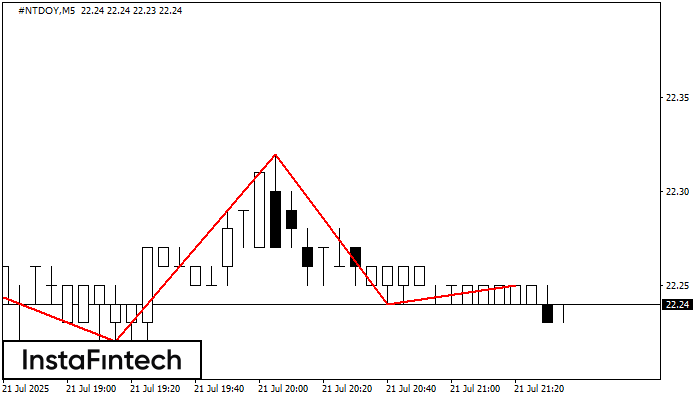
El #NTDOY M5 formó el patrón Cabeza y Hombros con las siguientes características: El techo de la Cabeza se encuentra en 22.32, la línea de cuello y el ángulo alcista
Los marcos de tiempo M5 y M15 pueden tener más puntos de entrada falsos.
Open chart in a new window