signal strength 1 of 5
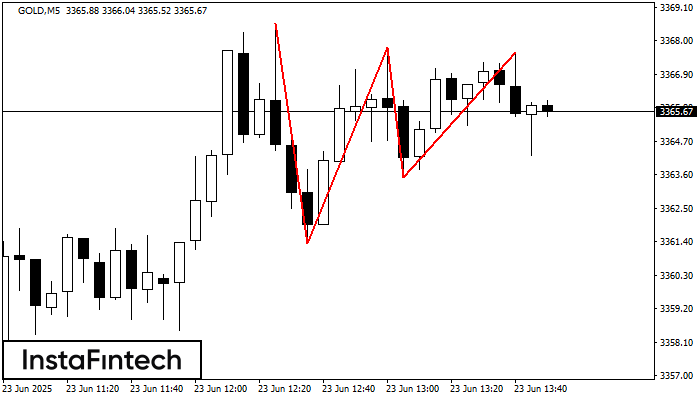
The Triple Top pattern has formed on the chart of the GOLD M5 trading instrument. It is a reversal pattern featuring the following characteristics: resistance level 97, support level -217, and pattern’s width 723. Forecast If the price breaks through the support level 3361.34, it is likely to move further down to 3367.62.
The M5 and M15 time frames may have more false entry points.
See Also
- All
- Double Top
- Flag
- Head and Shoulders
- Pennant
- Rectangle
- Triangle
- Triple top
- All
- #AAPL
- #AMZN
- #Bitcoin
- #EBAY
- #FB
- #GOOG
- #INTC
- #KO
- #MA
- #MCD
- #MSFT
- #NTDOY
- #PEP
- #TSLA
- #TWTR
- AUDCAD
- AUDCHF
- AUDJPY
- AUDUSD
- EURCAD
- EURCHF
- EURGBP
- EURJPY
- EURNZD
- EURRUB
- EURUSD
- GBPAUD
- GBPCHF
- GBPJPY
- GBPUSD
- GOLD
- NZDCAD
- NZDCHF
- NZDJPY
- NZDUSD
- SILVER
- USDCAD
- USDCHF
- USDJPY
- USDRUB
- All
- M5
- M15
- M30
- H1
- D1
- All
- Buy
- Sale
- All
- 1
- 2
- 3
- 4
- 5
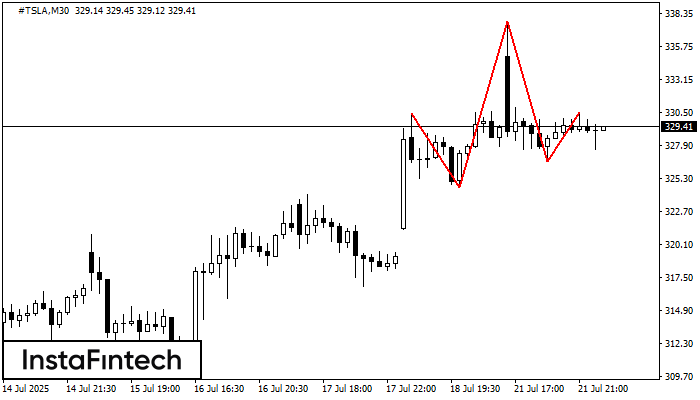
El #TSLA M30 formó el patrón Cabeza y Hombros con las siguientes características: El techo de la Cabeza se encuentra en 337.71, la línea de cuello y el ángulo alcista
Open chart in a new window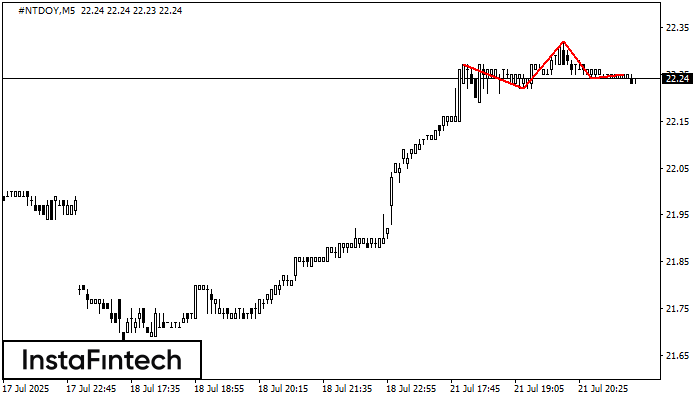
El patrón técnico llamado Cabeza y Hombros ha aparecido en el gráfico de #NTDOY M5. Existen razones poderosas para sugerir que el precio superará la línea de cuello 22.22/22.24 después
Los marcos de tiempo M5 y M15 pueden tener más puntos de entrada falsos.
Open chart in a new window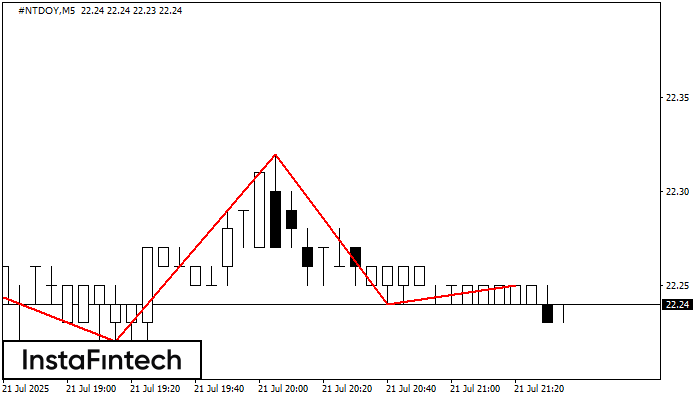
El #NTDOY M5 formó el patrón Cabeza y Hombros con las siguientes características: El techo de la Cabeza se encuentra en 22.32, la línea de cuello y el ángulo alcista
Los marcos de tiempo M5 y M15 pueden tener más puntos de entrada falsos.
Open chart in a new window