


Technical analysis
Figures of technical analysis
Pennant

The Pennant pattern is a well-known pattern that is widely used in technical analysis. This figure is regularly found on trading charts of almost all currency pairs.
The development of Pennant on the trading chart indicate continuation of the trend.
Head and shoulders
The "Head and Shoulders" pattern is primarily a reversal pattern. This pattern is formed on the basis of 3 tops or 3 bottoms, moreover the middle top(bottom) higher than the other two.
Double Top
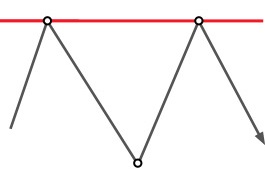
The Double Top pattern is an easily recognizable reversal pattern. This pattern is usually formed near the resistance level and signals a situation on the market when the price fails to break the resistance line two times in a row.
Rectangle
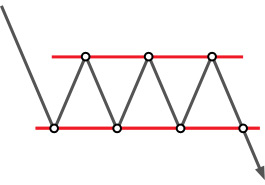
Rectangle - one of the most famous and simple methods of technical analysis in trade. Although it is easy to determine on the charts, this is an important and very strong figure, which is an indicator of the continuation of the trend. Due to the correct recognition of the rectangle, the trader can successfully enter the market.
Triangle
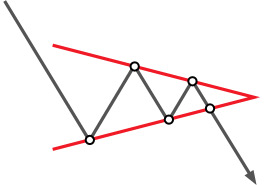
Triangles are among the most popular chart patterns used in technical analysis. This candlestick combination can be found on most financial instruments and on any time frame. Triangles fall under the category of continuation patterns, meaning that it is preceded by the trend, either bullish or bearish one.
Flag
The flag is a model predicting the continuation of the trend. As well as other similar figures of trend continuation, it is formed after a rapid price movement and is similar to a slowdown. When the flat is completed, followed by a continuation of the trend, usually the same strong as the trend before.
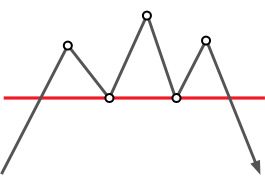
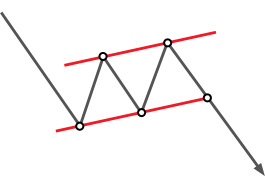
Triple Top

Triple top pattern is reversal pattern consisting of three equal highs followed by a break below the support level.


