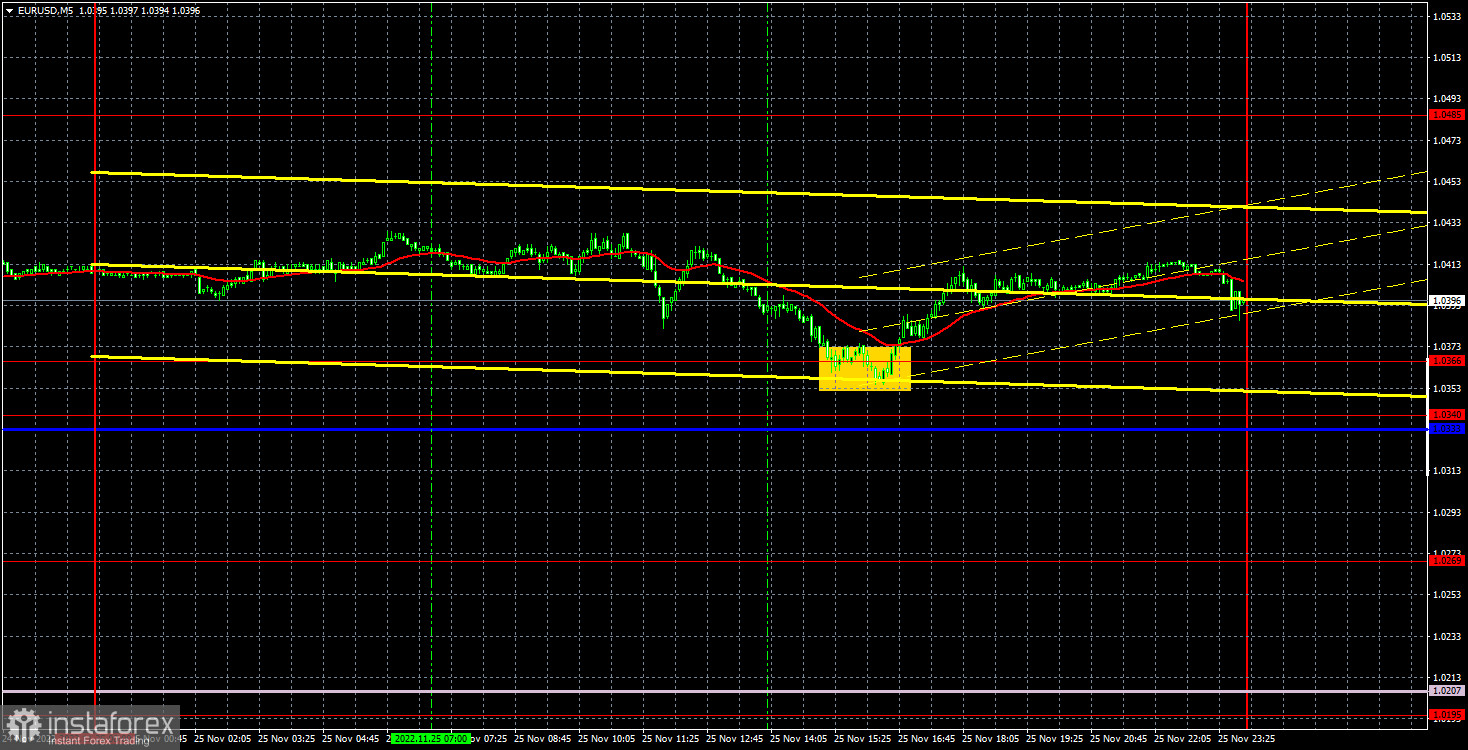
empty
28.11.2022 07:34 AM
Outlook and trading signals for EUR/USD on November 28. COT report. Analysis of market situation. The euro may start a long-awaited correction.

M5 chart of EUR/USD

This image is no longer relevant

During the last trading day of the week, the euro/dollar pair entered a bearish correction after a steep growth of the past several days. As a reminder, the price settled below the ascending trend line. However, it failed to settle below the Senkou Span B, and later on the euro also returned above the critical line. But it failed to update its local high of November 15, which suggests that the downtrend was cut short, which is now far from being evident. Nevertheless, we could anticipate a correction because the uptrend line has been crossed. There were no important and high-profile events in the EU and the U.S. on Friday, as well as during most of the past week. It may well be that the euro's growth was not quite logical again (although the right reasons can be "found", of course), so we still expect the EUR/USD to go down.

There is not much to say about Friday's technical signals, since there was only one throughout the day. At the beginning of the US session, the pair rebounded from the 1.0366-1.0340 area, so traders could open long positions there. It hardly made much profit, but you could earn around 20-30 pips, which is not bad either, considering the weak volatility and since there was almost no trend.
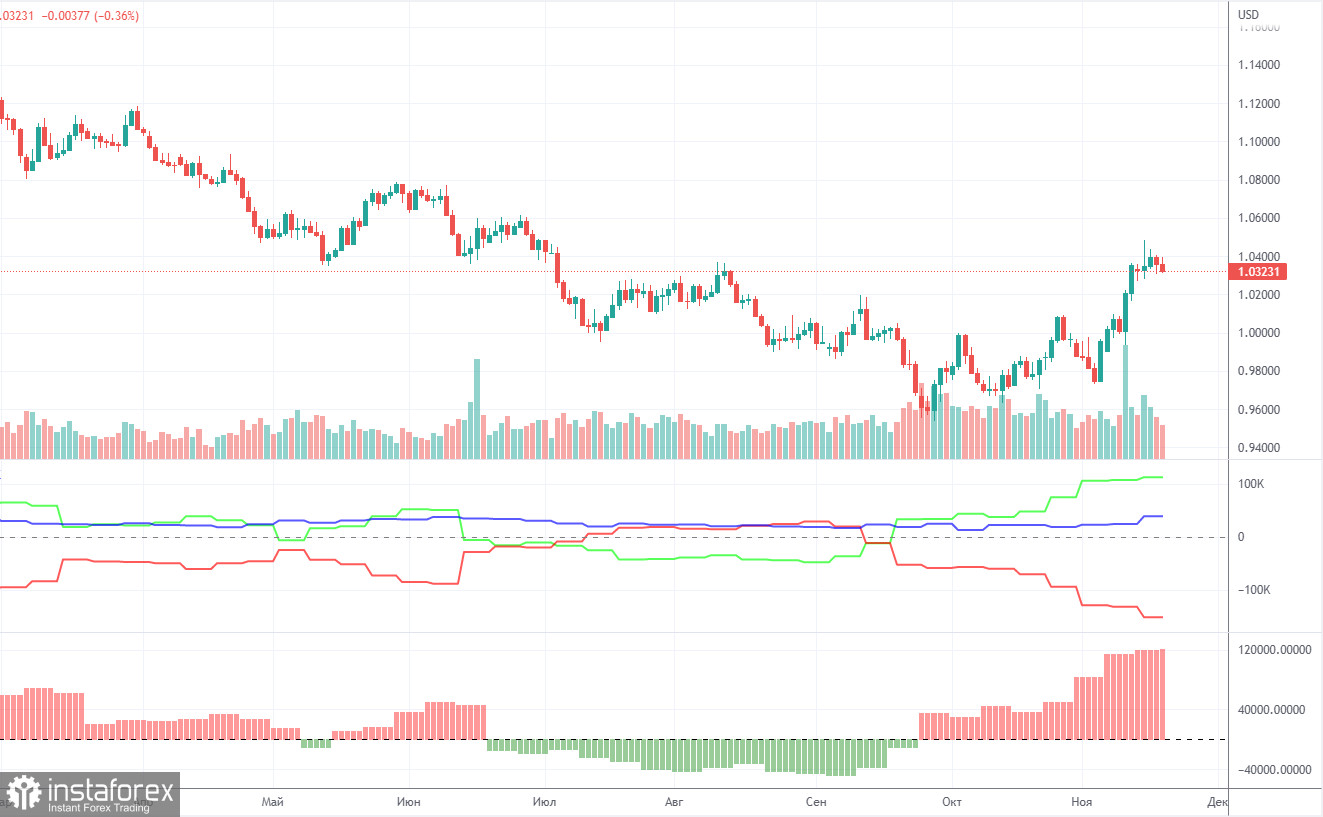
COT report

This image is no longer relevant

As for Commitment of Traders (COT) reports in 2022, they reflected bullish sentiment in the first six months of the year although the euro was bearish. Then, they illustrated bearish sentiment for several months with the euro being also bearish. Currently, the net position of non-commercial traders is again bullish and increasing. Meanwhile, the euro has hardly retreated from its 20-year lows. This is due to the fact that demand for the greenback is high amid a difficult geopolitical situation in the world. Therefore, despite a rise in demand for the euro, buoyant demand for the dollar does not allow the euro to strengthen. During the reporting week, the number of long positions held by non-commercial traders rose by 7,000 and that of short positions increased by 2,000. Consequently, the net position advanced by 5,000. The euro's recent growth is gradually coming in line with the figures illustrated in the COT report. Still, the greenback may resume growth under the influence of geopolitical factors or the lack of factors for further strengthening in the euro. The green and red lines of the first indicator moved far away from each other, which may indicate the end of the uptrend. The number of long positions exceeds that of short positions by 113,000. Therefore, the net position of non-commercial traders may continue to rise further, but without triggering a similar rise in the euro. When it comes to the total number of longs and shorts across all categories of traders, there are now 39,000 more short positions (635,000 vs 596,000).
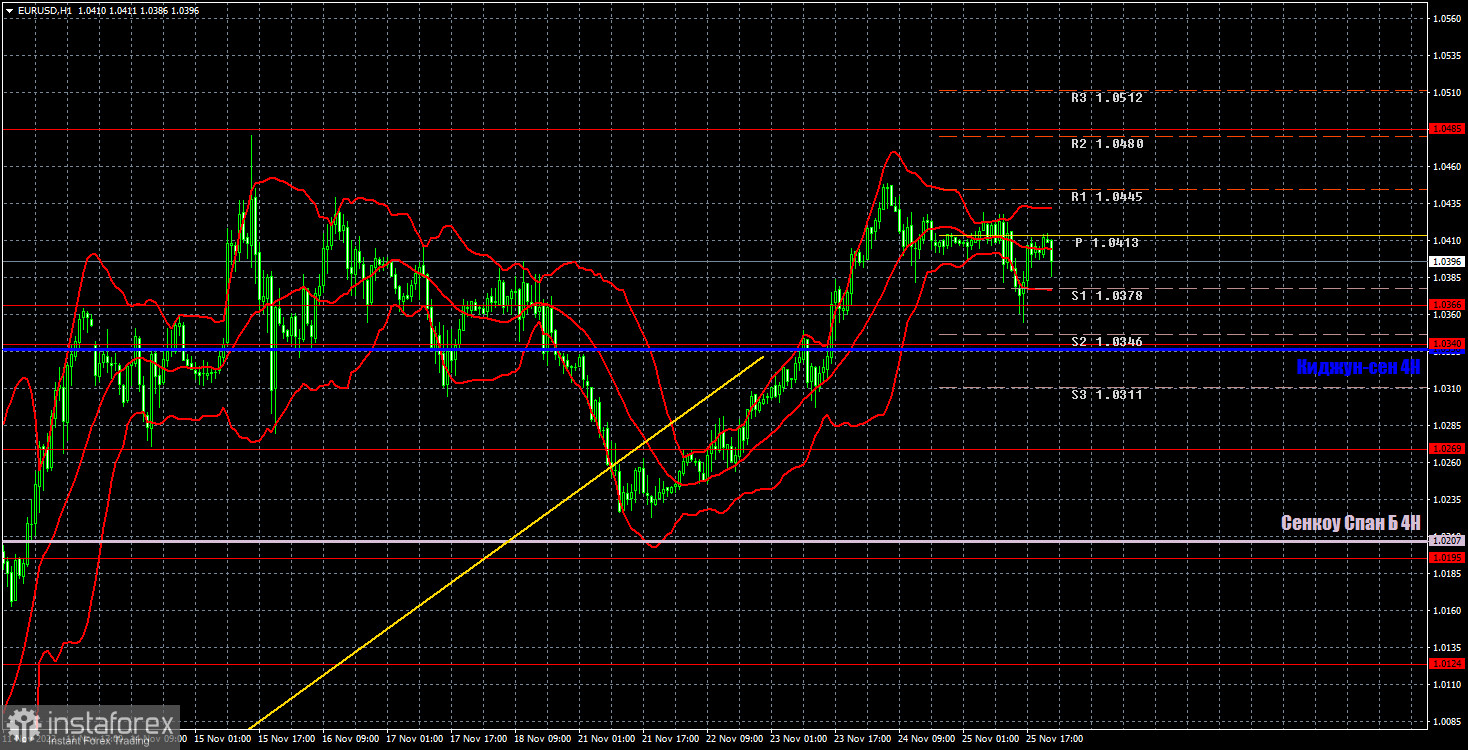
H1 chart of EUR/USD

This image is no longer relevant

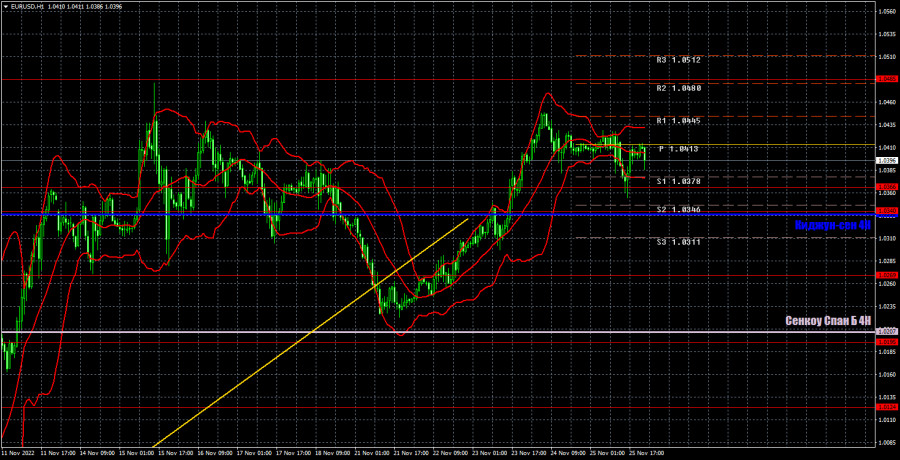
In the H1 time frame, EUR/USD tried to resume the uptrend, but stopped just before it updated its previous local high. Although the price broke through the trend line, fundamental factors provide little support for the euro, the market has not yet found any reason to sell, which we are waiting for. Anyway, we are still anticipating a strong bearish correction. On Monday, the pair may trade at the following levels: 1.0124, 1.0195, 1.0269, 1.0340-1.0366, 1.0485, 1.0579, 1.0637, as well as Senkou Span B lines (1.0207) and Kijun Sen (1.0336). Lines of the Ichimoku indicator may move during the day, which should be taken into account when determining trading signals. There are also support and resistance levels, but signals are not formed near these levels. Bounces and breakouts of the extreme levels and lines could act as signals. Don't forget about stop-loss orders, if the price covers 15 pips in the right direction. This will prevent you from losses in case of a false signal. On November 28, European Central Bank President Christine Lagarde will give a speech; however, all of the central bank's representatives are now in favor of further rate hikes, which traders are absolutely ready for. Lagarde may have something important to say (in theory) but the market is probably ready for that. Nothing of interest in America.

What we see on the trading charts:

Price levels of support and resistance are thick red lines, near which the movement may end. They do not provide trading signals.

The Kijun-sen and Senkou Span B lines are the lines of the Ichimoku indicator, moved to the one-hour chart from the 4-hour one. They are strong lines.

Extreme levels are thin red lines from which the price bounced earlier. They provide trading signals.

Yellow lines are trend lines, trend channels, and any other technical patterns.

Indicator 1 on the COT charts reflects the net position size of each category of traders.

Indicator 2 on the COT charts reflects the net position size for the non-commercial group.

Paolo Greco,
Analytical expert of InstaForex
© 2007-2025
Select timeframe
5
min
15
min
30
min
1
hour
4
hours
1
day
1
week
Earn on cryptocurrency rate changes with InstaForex
Download MetaTrader 4 and open your first trade
  • Grand Choice
    Contest by
    InstaForex
    InstaForex always strives to help you
    fulfill your biggest dreams.
    JOIN CONTEST

Recommended Stories

How to Trade the GBP/USD Pair on May 21? Simple Tips and Trade Analysis for Beginners

Analysis of Tuesday's Trades 1H Chart of GBP/USD The GBP/USD pair mainly traded sideways on Tuesday, but early Wednesday morning it surged upward. On the 4-hour timeframe, it's clear that

Paolo Greco 06:17 2025-05-21 UTC+2

How to Trade the EUR/USD Pair on May 21? Simple Tips and Trade Analysis for Beginners

Analysis of Tuesday's Trades 1H Chart of EUR/USD On Tuesday, the EUR/USD currency pair traded sideways, but it resumed its upward movement early Wednesday morning. This indicates that the ongoing

Paolo Greco 06:17 2025-05-21 UTC+2

Trading Recommendations and Analysis for GBP/USD on May 21: The British Pound Remains in a Flat Range

The GBP/USD currency pair continued to trade within the boundaries of a sideways channel on Tuesday, which has existed for over a month and is clearly visible. While on Monday

Paolo Greco 03:48 2025-05-21 UTC+2

Trading Recommendations and Analysis for EUR/USD on May 21: The Euro Continues to Climb

The EUR/USD currency pair mostly traded sideways throughout Tuesday. Unlike Monday, traders had no formal reason to sell the dollar, something they've been doing frequently lately. As a reminder, Monday's

Paolo Greco 03:48 2025-05-21 UTC+2

How to Trade the GBP/USD Pair on May 20? Simple Tips and Trade Analysis for Beginners

Analysis of Monday's Trades 1H Chart of GBP/USD Throughout Monday, the GBP/USD pair continued its upward movement, and at first glance, it might seem that a new uptrend is forming

Paolo Greco 05:40 2025-05-20 UTC+2

How to Trade the EUR/USD Pair on May 20? Simple Tips and Trade Analysis for Beginners

Analysis of Monday's Trades 1H Chart of EUR/USD The EUR/USD currency pair surged upward on Monday with renewed strength. But what justified this move, given that Monday's macroeconomic and fundamental

Paolo Greco 05:40 2025-05-20 UTC+2

Trading Recommendations and Analysis for GBP/USD on May 20: The Pound Keeps Seizing Every Opportunity

The GBP/USD currency pair continued its upward movement on Monday, which began last week. The price successfully broke through both Ichimoku indicator lines, so from a technical standpoint, the trend

Paolo Greco 04:09 2025-05-20 UTC+2

Trading Recommendations and Analysis for EUR/USD on May 20: The Dollar Is Looking for Reasons to Fall

The EUR/USD currency pair showed a relatively substantial rise on Monday. We believe there was no macroeconomic or fundamental justification for such a sharp depreciation of the U.S. dollar that

Paolo Greco 04:09 2025-05-20 UTC+2

How to Trade the EUR/USD Pair on May 19? Simple Tips and Trade Analysis for Beginners

Analysis of Friday's Trades 1H Chart of EUR/USD On Friday, the EUR/USD currency pair declined significantly in price, despite no macroeconomic or fundamental reasons. However, the downward trend

Paolo Greco 08:19 2025-05-19 UTC+2

Trading Recommendations and Analysis for GBP/USD on May 19: The Pound Feels Comfortable in a Flat Market

On Friday, the GBP/USD currency pair mainly traded downward throughout the day but closed with only a minor decline. This was mostly because the dollar weakened during the Asian session

Paolo Greco 04:42 2025-05-19 UTC+2
Can't speak right now?
Ask your question in the chat.
Widget callback
 

Dear visitor,

Your IP address shows that you are currently located in the USA. If you are a resident of the United States, you are prohibited from using the services of InstaFintech Group including online trading, online transfers, deposit/withdrawal of funds, etc.

If you think you are seeing this message by mistake and your location is not the US, kindly proceed to the website. Otherwise, you must leave the website in order to comply with government restrictions.

Why does your IP address show your location as the USA?

  • - you are using a VPN provided by a hosting company based in the United States;
  • - your IP does not have proper WHOIS records;
  • - an error occurred in the WHOIS geolocation database.

Please confirm whether you are a US resident or not by clicking the relevant button below. If you choose the wrong option, being a US resident, you will not be able to open an account with InstaForex anyway.

We are sorry for any inconvenience caused by this message.