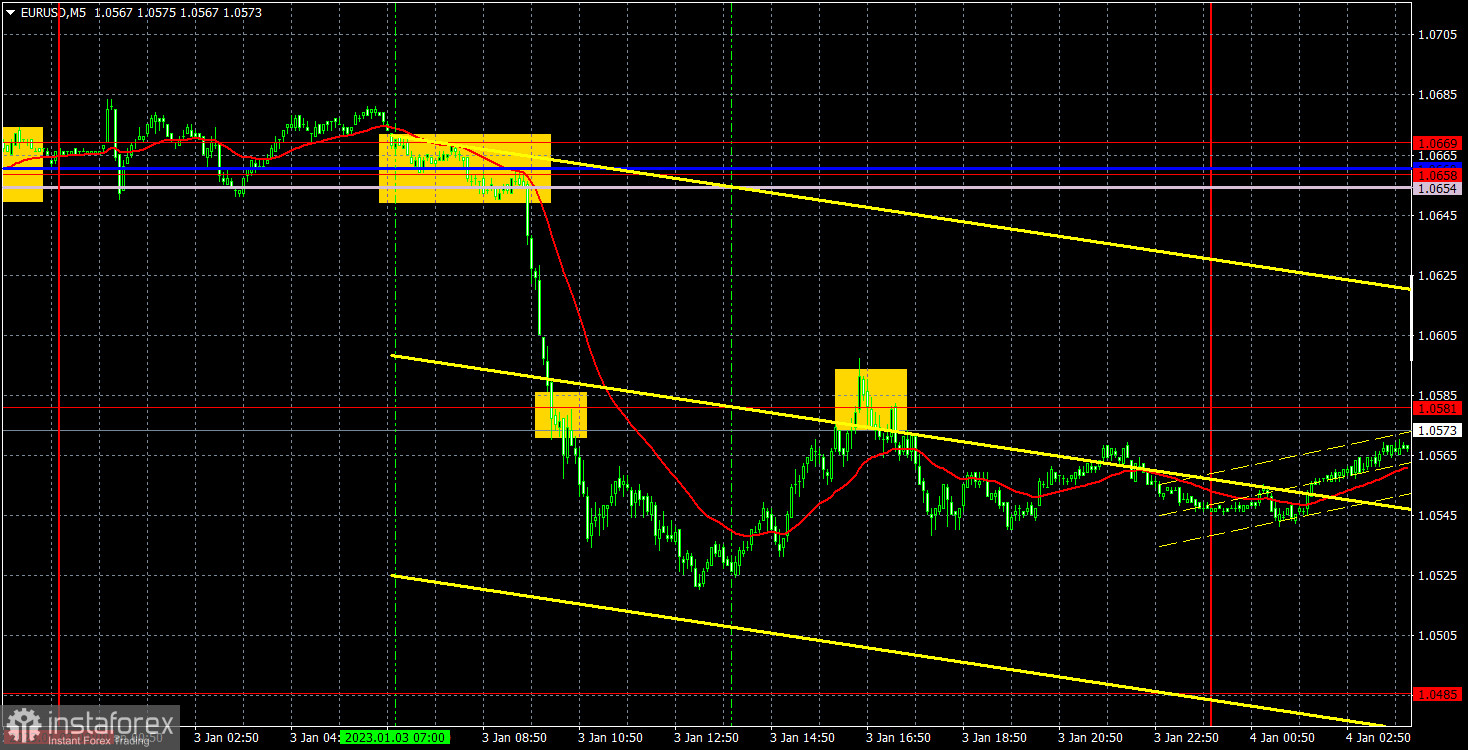
empty
04.01.2023 07:59 AM
Outlook and trading signals for EUR/USD on January 4. COT report. Analysis of market situation. The market woke up and remembered the dollar.

M5 chart of EUR/USD

This image is no longer relevant

EUR/USD started the bearish correction that I have been talking about for a long time. Of course, it is too early to conclude that the fall will be strong and could take long, but yesterday the pair made a big step towards this scenario. I have been mentioning a strong correction since 3 weeks ago, but there were no sell signals on the higher charts, and the market continued to buy the pair even when there were no reasons to do so. The only macro data from yesterday that I could mention are the data on German inflation and U.S. manufacturing activity. German inflation went down from 10% to 8.6% while CPI has fallen from 47.7 to 46.2. It is unlikely that the euro fell because of these reports.

But yesterday's technical picture was quite pleasant. In the very beginning of the European session, there was a sell signal near the Ichimoku indicator, later the price crossed 1.0581 and went down about 50 pips. Unfortunately, the price failed to reach the next target level of 1.0485, but there was no buy signal during the day. Therefore, the deal had to be closed manually closer to the evening with profit around 80 pips.
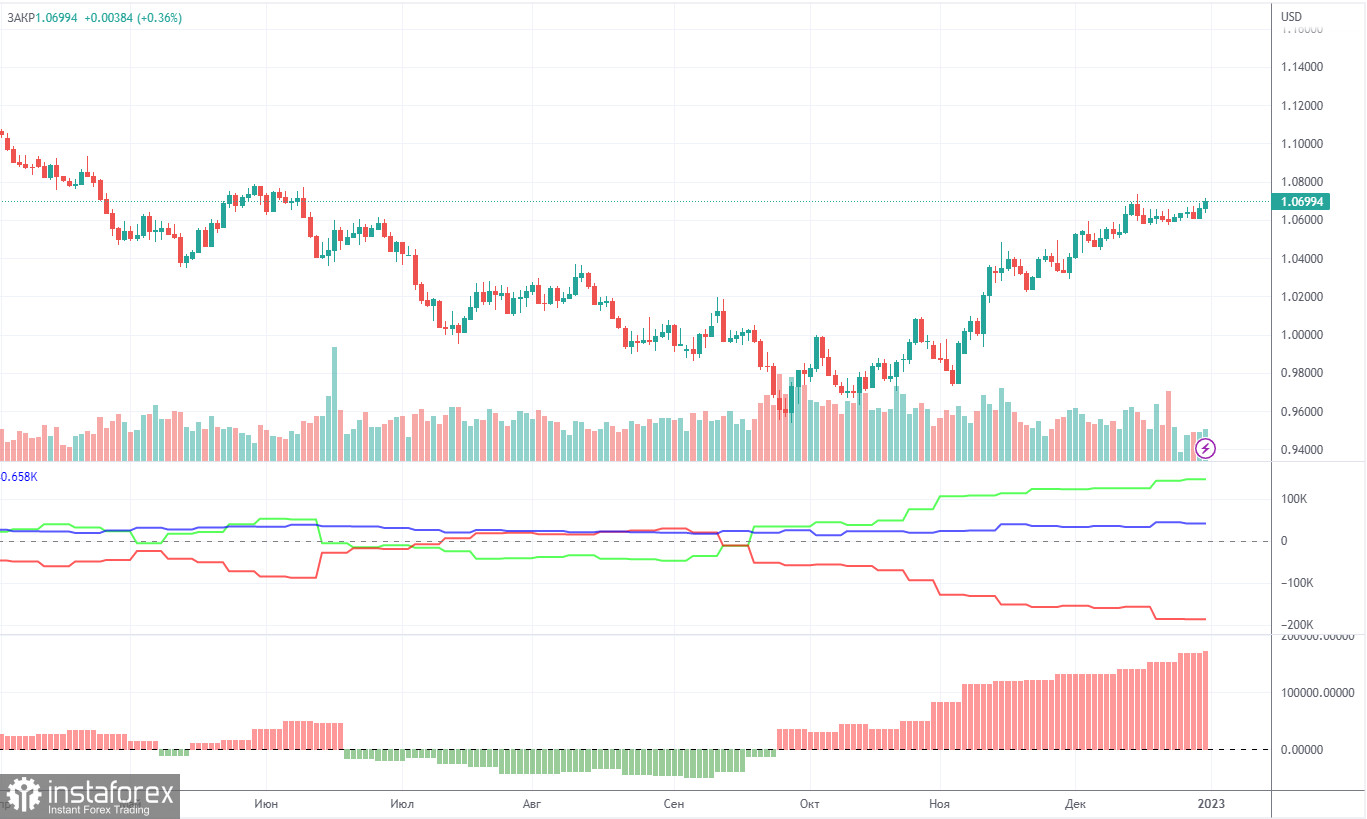
COT report

This image is no longer relevant

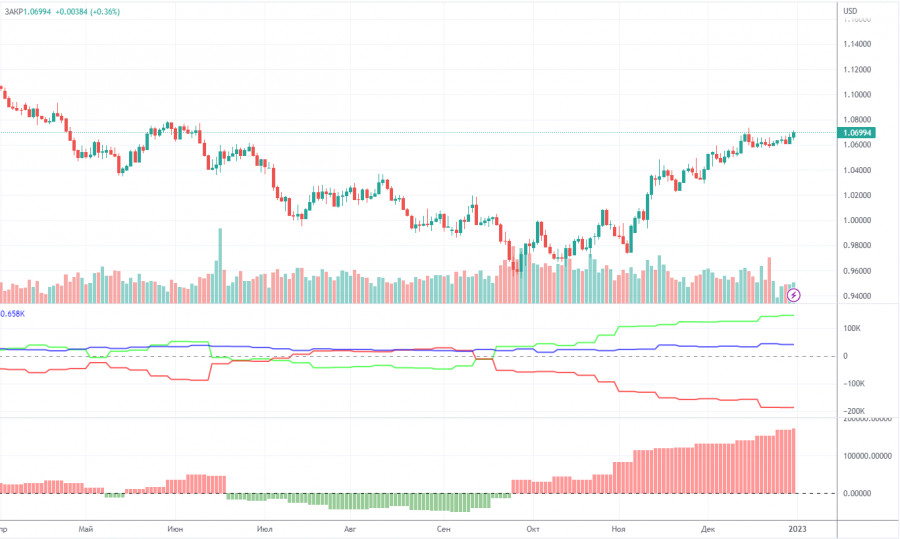
The COT reports for the euro in the last few months have been fully consistent with what is happening in the market. You can clearly see on the chart that the net position of big players (the second indicator) has been growing since early September. Around the same time, the euro started to grow. At this time, the net position of the non-commercial traders has been bullish and strengthens almost every week, but it is a rather high value that allows us to assume that the upward movement will end soon. Notably, the green and red lines of the first indicator have moved far apart from each other, which often means the end of the trend. During the given period, non-commercial traders opened 2,700 long positions, whereas the number of short positions fell by 1,100. Thus, the net positions rose by 3,800. The number of long positions is 146,000 higher than the number of short positions opened by non-commercial traders. So the question now is how long will the big players increase their longs? Moreover, from a technical perspective, a bearish correction should have started a long time ago. In my opinion, this process can not continue for another 2 or 3 months. Even the net position indicator shows that we need to "unload" a bit, that is, to correct. The overall number of short orders exceeds the number of long orders by 41,000 (685,000 vs. 644,000).

H1 chart of EUR/USD

This image is no longer relevant

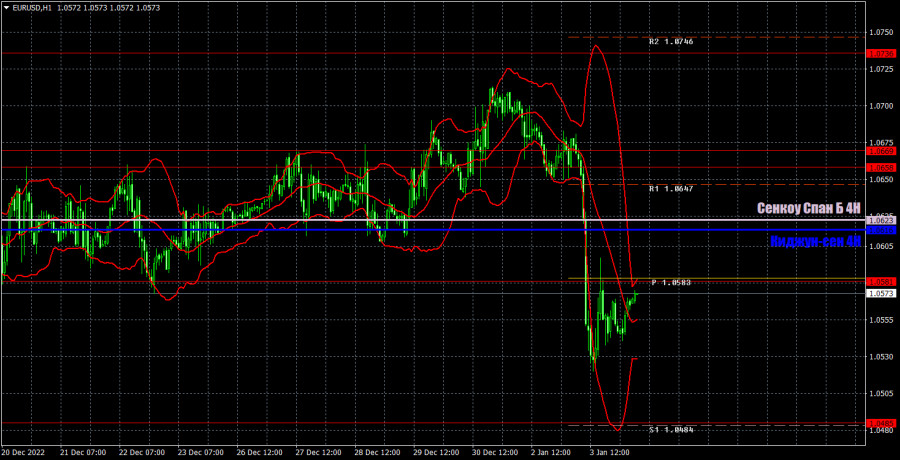
EUR/USD resumed the downward movement on the one-hour chart, and settled below the horizontal channel, in which it spent several weeks. I expect the euro to fall further, which can only be prevented by Friday's US data. However, I believe that even if they turn out to be weak, in the mid term the US dollar will still show growth. The euro has risen too much and for no reason at all over the last months, a correction is necessary. On Wednesday, the pair may trade at the following levels: 1.0269, 1.0340-1.0366, 1.0485, 1.0581, 1.0658-1.0669, and also Senkou Span B lines (1.0623) and Kijun Sen (1.0616). Lines of the Ichimoku indicator may move during the day, which should be taken into account when determining trading signals. There are also support and resistance levels, but signals are not formed near these levels. Bounces and breakouts of the extreme levels and lines could act as signals. Don't forget about stop-loss orders, if the price covers 15 pips in the right direction. This will prevent you from losses in case of a false signal. On January 4, the ISM manufacturing activity index for December will be released in the US, followed by the Federal Reserve minutes later in the evening. I don't expect the market to show a significant reaction to the minutes, but the ISM index might provoke one in case its value is much different from the forecasts.

What we see on the trading charts:

Price levels of support and resistance are thick red lines, near which the movement may end. They do not provide trading signals.

The Kijun-sen and Senkou Span B lines are the lines of the Ichimoku indicator, moved to the one-hour chart from the 4-hour one. They are strong lines.

Extreme levels are thin red lines from which the price bounced earlier. They provide trading signals.

Yellow lines are trend lines, trend channels, and any other technical patterns.

Indicator 1 on the COT charts reflects the net position size of each category of traders.

Indicator 2 on the COT charts reflects the net position size for the non-commercial group.

Paolo Greco,
Analytical expert of InstaForex
© 2007-2025
Select timeframe
5
min
15
min
30
min
1
hour
4
hours
1
day
1
week
Earn on cryptocurrency rate changes with InstaForex
Download MetaTrader 4 and open your first trade
  • Grand Choice
    Contest by
    InstaForex
    InstaForex always strives to help you
    fulfill your biggest dreams.
    JOIN CONTEST

Recommended Stories

How to Trade the GBP/USD Pair on May 20? Simple Tips and Trade Analysis for Beginners

Analysis of Monday's Trades 1H Chart of GBP/USD Throughout Monday, the GBP/USD pair continued its upward movement, and at first glance, it might seem that a new uptrend is forming

Paolo Greco 05:40 2025-05-20 UTC+2

How to Trade the EUR/USD Pair on May 20? Simple Tips and Trade Analysis for Beginners

Analysis of Monday's Trades 1H Chart of EUR/USD The EUR/USD currency pair surged upward on Monday with renewed strength. But what justified this move, given that Monday's macroeconomic and fundamental

Paolo Greco 05:40 2025-05-20 UTC+2

Trading Recommendations and Analysis for GBP/USD on May 20: The Pound Keeps Seizing Every Opportunity

The GBP/USD currency pair continued its upward movement on Monday, which began last week. The price successfully broke through both Ichimoku indicator lines, so from a technical standpoint, the trend

Paolo Greco 04:09 2025-05-20 UTC+2

Trading Recommendations and Analysis for EUR/USD on May 20: The Dollar Is Looking for Reasons to Fall

The EUR/USD currency pair showed a relatively substantial rise on Monday. We believe there was no macroeconomic or fundamental justification for such a sharp depreciation of the U.S. dollar that

Paolo Greco 04:09 2025-05-20 UTC+2

How to Trade the EUR/USD Pair on May 19? Simple Tips and Trade Analysis for Beginners

Analysis of Friday's Trades 1H Chart of EUR/USD On Friday, the EUR/USD currency pair declined significantly in price, despite no macroeconomic or fundamental reasons. However, the downward trend

Paolo Greco 08:19 2025-05-19 UTC+2

Trading Recommendations and Analysis for GBP/USD on May 19: The Pound Feels Comfortable in a Flat Market

On Friday, the GBP/USD currency pair mainly traded downward throughout the day but closed with only a minor decline. This was mostly because the dollar weakened during the Asian session

Paolo Greco 04:42 2025-05-19 UTC+2

Trading Recommendations and Analysis for EUR/USD on May 19: The Dollar Struggles to Grow, but Still Does

The EUR/USD currency pair showed a slight decline on Friday. Although the 5-minute chart might suggest the pair spent the entire day in a downtrend, the U.S. dollar gained only

Paolo Greco 04:42 2025-05-19 UTC+2

How to Trade the GBP/USD Pair on May 19? Simple Tips and Trade Analysis for Beginners

Analysis of Friday's Trades 1H Chart of GBP/USD On Friday, the GBP/USD pair also traded lower, although there were no objective reasons. While the euro maintains a downward trend

Paolo Greco 00:35 2025-05-19 UTC+2

How to Trade the GBP/USD Pair on May 16? Simple Tips and Trade Analysis for Beginners

Analysis of Thursday's Trades 1H Chart of GBP/USD On Thursday, the GBP/USD pair showed minimal upward movement; however, the 5-minute timeframe indicates this was largely a sideways move

Paolo Greco 06:17 2025-05-16 UTC+2

How to Trade the EUR/USD Pair on May 16? Simple Tips and Trade Analysis for Beginners

Analysis of Thursday's Trades 1H Chart of EUR/USD The EUR/USD currency pair traded in both directions throughout Thursday. The macroeconomic background was rich, but it had no decisive impact

Paolo Greco 06:17 2025-05-16 UTC+2
Can't speak right now?
Ask your question in the chat.
Widget callback
 

Dear visitor,

Your IP address shows that you are currently located in the USA. If you are a resident of the United States, you are prohibited from using the services of InstaFintech Group including online trading, online transfers, deposit/withdrawal of funds, etc.

If you think you are seeing this message by mistake and your location is not the US, kindly proceed to the website. Otherwise, you must leave the website in order to comply with government restrictions.

Why does your IP address show your location as the USA?

  • - you are using a VPN provided by a hosting company based in the United States;
  • - your IP does not have proper WHOIS records;
  • - an error occurred in the WHOIS geolocation database.

Please confirm whether you are a US resident or not by clicking the relevant button below. If you choose the wrong option, being a US resident, you will not be able to open an account with InstaForex anyway.

We are sorry for any inconvenience caused by this message.