When to open long positions on GBP/USD:
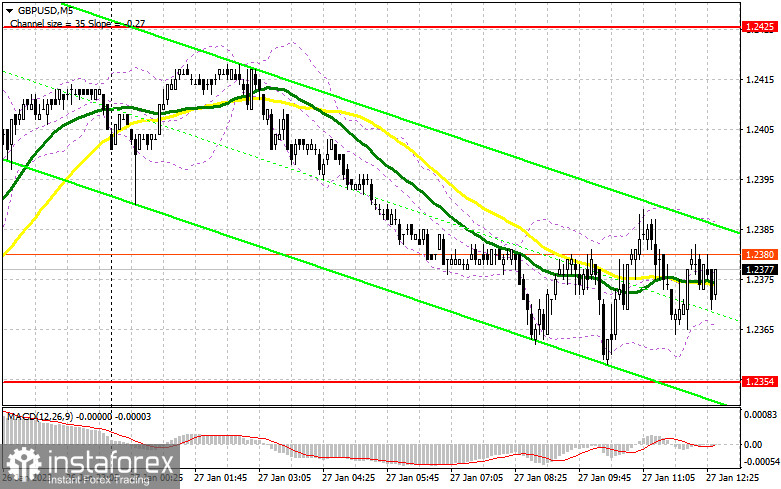
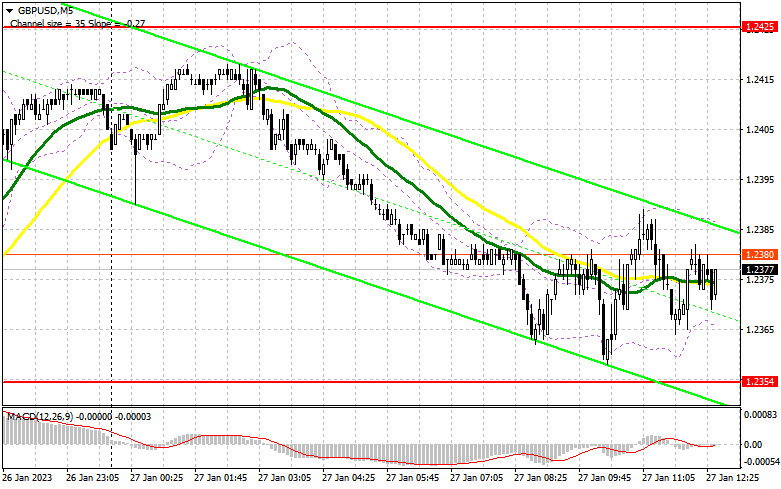
In the first half of the day, no entry signals were generated. Let's take a look at the M5 chart to get a picture of what happened. Due to low volatility in the market, no test occurred at the level I focus on. Consequently, no entry points were created. In addition, I have reviewed the trading plan for the second half of the day.
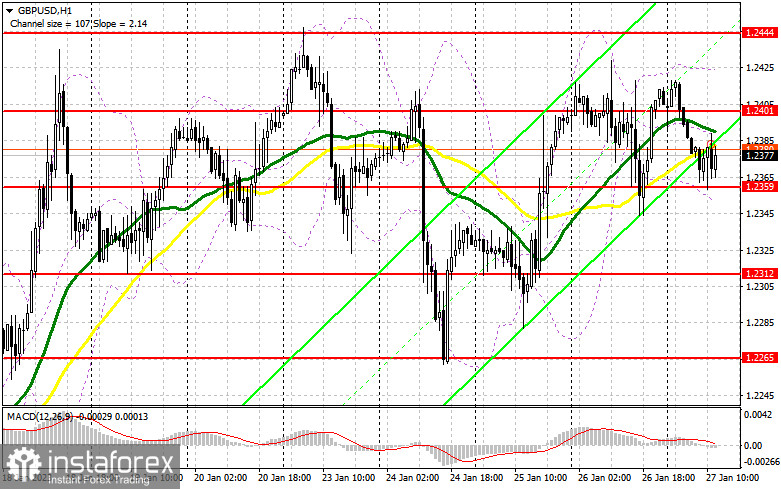
There is clearly some pressure on the pair. Therefore, a lot will depend on how the market reacts to macro data from the US. In fact, these reports have a significant impact on the Fed's monetary policy decisions. It is too bad many traders underestimate these macroeconomic indicators. Here I'm talking about personal spending and personal income. The more people earn, the more they spend. That leads to higher inflation, which the Fed is currently trying to tame. Therefore, if upbeat macro data boosts demand for the greenback, it should not come as surprise. The University of Michigan consumer and inflation expectations may also be the driving force for the GBP/USD sellers. The focus is now on the nearest support level of 1.2359. If the bulls lose control of the level, the pair will unlikely rise until the Fed meeting at least. Therefore, only in case of a false breakout through 1.2359, the bullish impulse will return the price to new resistance at 1.2401. Consolidation above this barrier will lead to an increase in demand for the pair. The bulls will have a chance to update the monthly high at around 1.2444. A rise and a test of this mark to the downside will push the price to 1.2487 where I am going to lock in profits. If the bulls lose control of the 1.2359 mark, pressure on the pair will mount, and a bearish correction will start. Therefore, long positions could be opened after a fall and a false breakout through 1.2312. It will also become possible to buy GBP/USD on a rebound from 1.2265, allowing a correction of 30 to 35 pips intraday.
When to open short positions on GBP/USD:
It depends on US macro data whether the pound ascends or descends in the second half of the day. The bears have shifted their focus to the 1.2359 mark. Nevertheless, they should not forget that they should also protect new resistance at 1.2401. In case US data comes disappointing and the price skyrockets, a false breakout through 1.2401 will make a sell signal with the target at 1.2359. A breakout and a retest of this mark to the upside will create a sell entry point with the target at 1.2312. The most distant target stands at 1.2265 where I'm going to lock in profits. If GBP/USD goes down and there is no bullish activity at 1.2401 in the second half of the day, we will see a bullish continuation. In such a case, long positions could be opened after a false breakout through the monthly high of 1.2444. If there is no activity there either, I will sell GBP/USD from the 1.2487 high, allowing a bearish correction of 30 to 35 pips intraday.
Commitments of Traders:
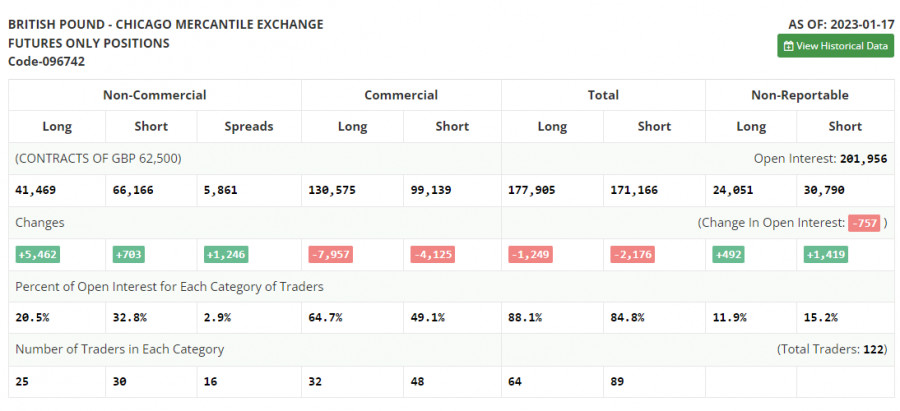
According to the Commitments of Traders report for January 17, the number of long and short positions increased. It is important to understand that the Fed's aggressive policy is no longer as effective as it used to be. A slowdown in economic growth and a decrease in retail sales are the first signals of a looming recession in the US. At the same time, the Bank of England keeps fighting against inflation. Although the reading fell slightly, it is still not enough for the regulator to change its monetary stance. Therefore, aggressive tightening is likely to go on. That could help the pound offset previous losses. According to the latest COT report, short non-commercial positions increased by 703 to 66,166. Long non-commercial positions surged by 5,4628 to 41,469. Consequently, the non-commercial net position came in at -24,697 versus -29,456 a week ago. These are insignificant changes. Therefore, they are unlikely to affect market sentiment. That is why it is important to monitor macroeconomic reports in the UK as they could help understand what the BoE could do next. The weekly closing price of GBP/USD increased to 1.2290 from 1.2182.
Indicator signals:
Moving averages
Trading is carried out near the 30-day and 50-day moving averages, indicating market uncertainty.
Note: The period and prices of moving averages are viewed by the author on the hourly chart and differ from the general definition of classic daily moving averages on the daily chart.
Bollinger Bands
Resistance is seen at 1.2423, in line with the upper band.
Indicator description:
- Moving average (MA) determines the current trend by smoothing volatility and noise. Period 50. Colored yellow on the chart.
- Moving average (MA) determines the current trend by smoothing volatility and noise. Period 30. Colored green on the chart.
- Moving Average Convergence/Divergence (MACD). Fast EMA 12. Slow EMA 26. SMA 9.
- Bollinger Bands. Period 20
- Non-commercial traders are speculators such as individual traders, hedge funds, and large institutions who use the futures market for speculative purposes and meet certain requirements.
- Long non-commercial positions are the total long position of non-commercial traders.
- Non-commercial short positions are the total short position of non-commercial traders.
- Total non-commercial net position is the difference between the short and long positions of non-commercial traders.