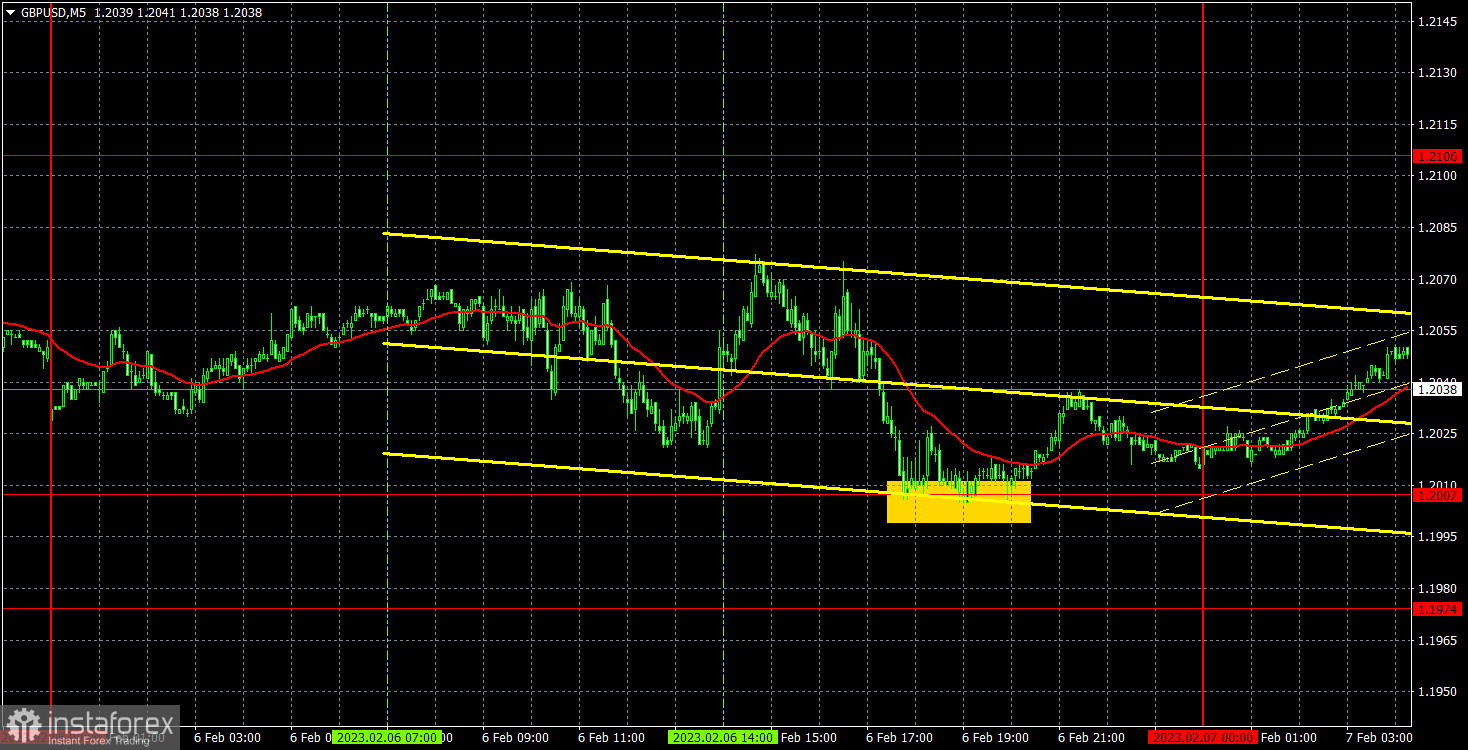
empty
07.02.2023 08:27 AM
Outlook and trading signals for GBP/USD on February 7. COT report. Pound retreats from the collapse

M5 chart of GBP/USD

This image is no longer relevant

GBP/USD managed to avoid sharp losses on Monday, but still fell several dozens of points. In general, it moved mostly sideways than downward, so we can say that the market "recovered" from the events of the previous week, which triggered the fall of the British currency by more than 300 pips. There was almost no macro data yesterday. The only thing worth mentioning was the UK construction PMI, which fell by 0.4 points to 48.4 in January. The pound lost about 40 points after this report, but globally it did not influence the alignment of forces between the pound and the dollar. This week, fundamentals and macroeconomics might be weak, so we will probably witness a flat or movement with just a short trend in the coming days.

Speaking of trading signals, they were also quite dull. The first and only trading signal was formed in the middle of the US trading session, when the price rebounded from 1.2007. After that it managed to go up about 20 pips, but anyway the signal was formed too late to work it out. Therefore, there were no deals on Monday. After the pair's fall, lines of the Ichimoku indicator have not yet had time to "catch up" to the price, so they are much higher and almost do not participate in the process of forming a signal.
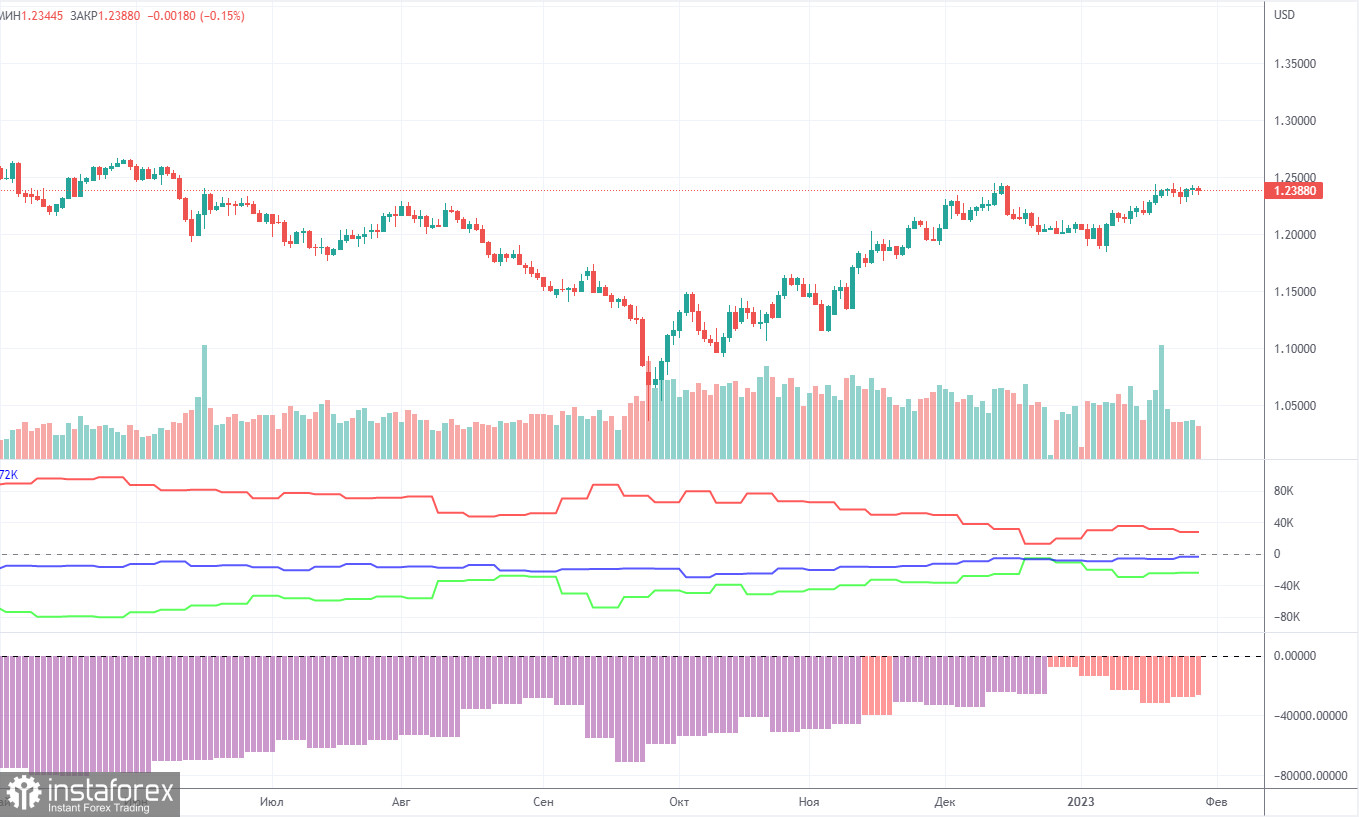
COT report

This image is no longer relevant

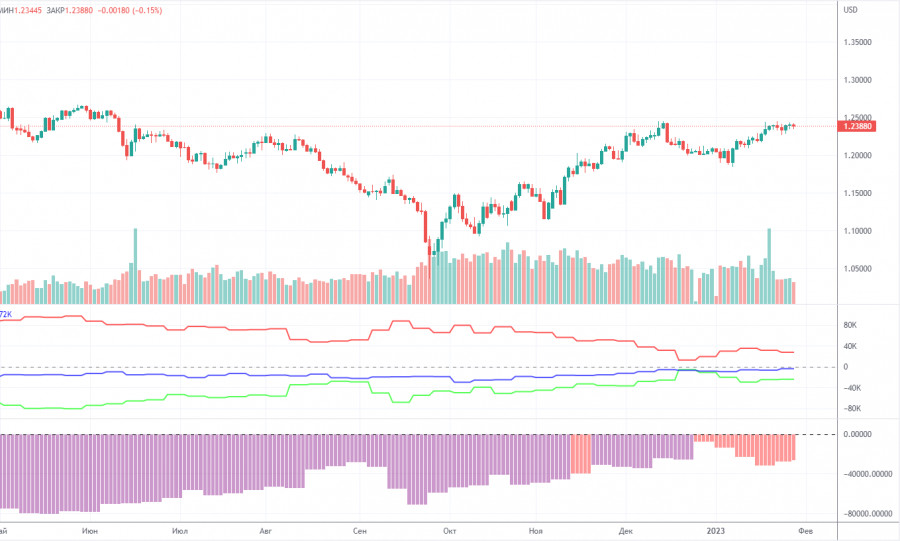
The recent COT report on the pound sterling unveiled that the bearish sentiment became weaker. During the week, non-commercial traders closed 6,700 buy contracts and 78,500 sell contracts. Thus, the net position of non-commercial traders increased by 800. During the last few months, the net position was increasing quite stably. The sentiment of big traders could become bullish in the near future. It is still very hard to explain why the pound sterling increased so much against the US dollar. In the mid-term, the British pound could drop as it needs correction. In general, the recent COT reports have been corresponding to the pound's movement. Since the net position is not bullish anymore, traders may buy the asset in the next few months. By the moment, non-commercial traders have opened 35,000 longs and 59,000 shorts. We do not expect long-lasting growth in the pound sterling. Although it has technical reasons for that, the fundamental and geopolitical factors do not presuppose a strong and fast increase.
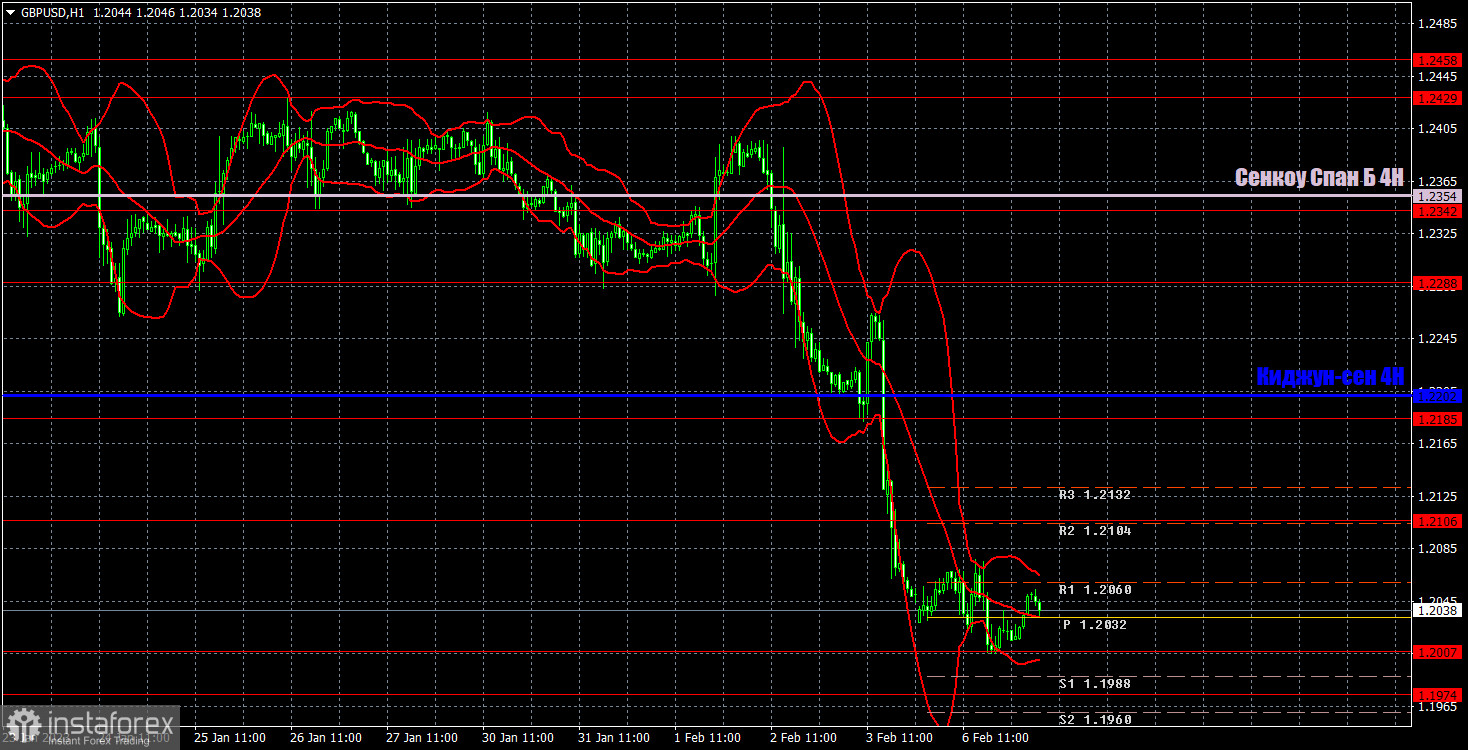
H1 chart of GBP/USD

This image is no longer relevant

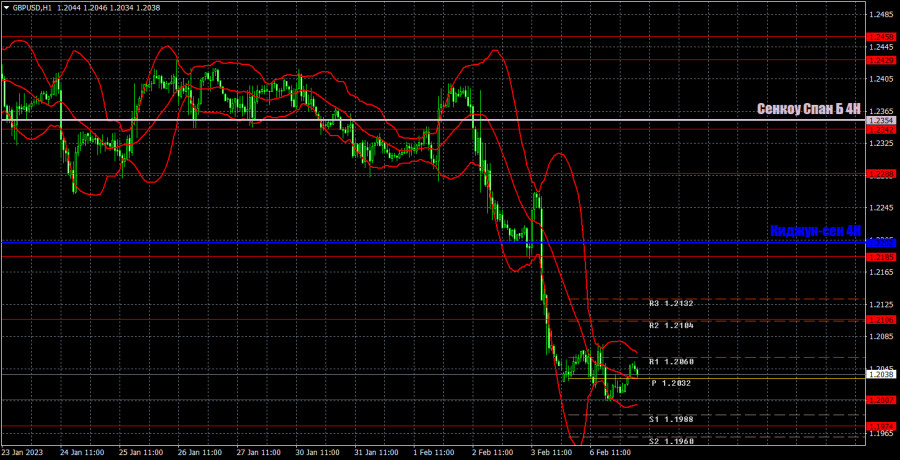
On the one-hour chart, GBP is still moving downward and it is difficult to say what can support the British currency this week. Of course, a purely technical pullback might start and we are likely to see it this week. But at the same time, several technical indicators are signaling the pound's decline. In particular, the Double Top and consolidation below the critical line on the 24-hour chart. For February 7, here are the following important levels: 1.1760, 1.1874, 1.1974-1.2007, 1.2106, 1.2185, 1.2288, 1.2342. Senkou Span B (1.2354) and Kijun-Sen (1.2202) lines can also be sources of signals. Pullbacks and breakouts through these lines may produce signals as well. A Stop Loss order should be set at the breakeven point after the price passes 20 pips in the right direction. Ichimoku indicator lines may move during the day, which should be taken into account when determining trading signals. In addition, the chart does illustrate support and resistance levels, which could be used to lock in profits. On Tuesday, several members of the Bank of England's Monetary Committee will deliver speeches in the UK and Federal Reserve Chairman Jerome Powell will be speaking in the US. We are not expecting any important information from these officials since we've already heard everything from the central banks last week.

What we see on the trading charts:

Price levels of support and resistance are thick red lines, near which the movement may end. They do not provide trading signals.

The Kijun-sen and Senkou Span B lines are the lines of the Ichimoku indicator, moved to the one-hour chart from the 4-hour one. They are strong lines.

Extreme levels are thin red lines from which the price bounced earlier. They provide trading signals.

Yellow lines are trend lines, trend channels, and any other technical patterns.

Indicator 1 on the COT charts reflects the net position size of each category of traders.

Indicator 2 on the COT charts reflects the net position size for the non-commercial group.

Paolo Greco,
Analytical expert of InstaForex
© 2007-2025
Select timeframe
5
min
15
min
30
min
1
hour
4
hours
1
day
1
week
Earn on cryptocurrency rate changes with InstaForex
Download MetaTrader 4 and open your first trade
  • Grand Choice
    Contest by
    InstaForex
    InstaForex always strives to help you
    fulfill your biggest dreams.
    JOIN CONTEST

Recommended Stories

How to Trade the GBP/USD Pair on May 23? Simple Tips and Trade Analysis for Beginners

Analysis of Thursday's Trades 1H Chart of GBP/USD The GBP/USD pair didn't even attempt a correction on Thursday. While the euro faced bearish pressure from weak business activity indices

Paolo Greco 05:58 2025-05-23 UTC+2

How to Trade the EUR/USD Pair on May 23? Simple Tips and Trade Analysis for Beginners

Analysis of Thursday's Trades 1H Chart of EUR/USD On Thursday, the EUR/USD currency pair corrected to the nearest support level on the hourly timeframe, which was at 1.1267. Multiple factors

Paolo Greco 05:57 2025-05-23 UTC+2

Trading Recommendations and Analysis for GBP/USD on May 23: Pound Prepares for a Historic Breakout

The GBP/USD currency pair broke out of its sideways channel through the upper boundary, but it is in no hurry to continue rising. Traders appear to be gathering momentum

Paolo Greco 03:43 2025-05-23 UTC+2

Trading Recommendations and Analysis for EUR/USD on May 23: The Euro Couldn't Withstand the Pressure

On Thursday, the EUR/USD currency pair traded lower, which can be considered an exception to the general trend. Nearly all macroeconomic reports during the day were unfavorable for the euro

Paolo Greco 03:43 2025-05-23 UTC+2

How to Trade the GBP/USD Pair on May 22? Simple Tips and Trade Analysis for Beginners

Analysis of Wednesday's Trades 1H Chart of GBP/USD The GBP/USD pair maintained its upward trend on Wednesday, a movement that has developed over the past two weeks. Recall that

Paolo Greco 06:31 2025-05-22 UTC+2

How to Trade the EUR/USD Pair on May 22? Simple Tips and Trade Analysis for Beginners

Analysis of Wednesday's Trades 1H Chart of EUR/USD On Wednesday, the EUR/USD currency pair continued its upward movement calmly and steadily. The price broke through the 1.1267 level, which

Paolo Greco 06:31 2025-05-22 UTC+2

Trading Recommendations and Analysis for GBP/USD on May 22: The Pound Breaks Through Key Levels

The GBP/USD currency pair also resumed its upward movement on Wednesday. The rise of the British pound, which in reality still reflects the fall of the US dollar, began overnight

Paolo Greco 03:30 2025-05-22 UTC+2

Trading Recommendations and Analysis for EUR/USD on May 22: Reasons Don't Matter and Aren't Needed

The EUR/USD currency pair resumed its upward movement on Wednesday, and it is now safe to say that the uptrend is present not only in the hourly timeframe but also

Paolo Greco 03:30 2025-05-22 UTC+2

How to Trade the GBP/USD Pair on May 21? Simple Tips and Trade Analysis for Beginners

Analysis of Tuesday's Trades 1H Chart of GBP/USD The GBP/USD pair mainly traded sideways on Tuesday, but early Wednesday morning it surged upward. On the 4-hour timeframe, it's clear that

Paolo Greco 06:17 2025-05-21 UTC+2

How to Trade the EUR/USD Pair on May 21? Simple Tips and Trade Analysis for Beginners

Analysis of Tuesday's Trades 1H Chart of EUR/USD On Tuesday, the EUR/USD currency pair traded sideways, but it resumed its upward movement early Wednesday morning. This indicates that the ongoing

Paolo Greco 06:17 2025-05-21 UTC+2
Can't speak right now?
Ask your question in the chat.
Widget callback
 

Dear visitor,

Your IP address shows that you are currently located in the USA. If you are a resident of the United States, you are prohibited from using the services of InstaFintech Group including online trading, online transfers, deposit/withdrawal of funds, etc.

If you think you are seeing this message by mistake and your location is not the US, kindly proceed to the website. Otherwise, you must leave the website in order to comply with government restrictions.

Why does your IP address show your location as the USA?

  • - you are using a VPN provided by a hosting company based in the United States;
  • - your IP does not have proper WHOIS records;
  • - an error occurred in the WHOIS geolocation database.

Please confirm whether you are a US resident or not by clicking the relevant button below. If you choose the wrong option, being a US resident, you will not be able to open an account with InstaForex anyway.

We are sorry for any inconvenience caused by this message.