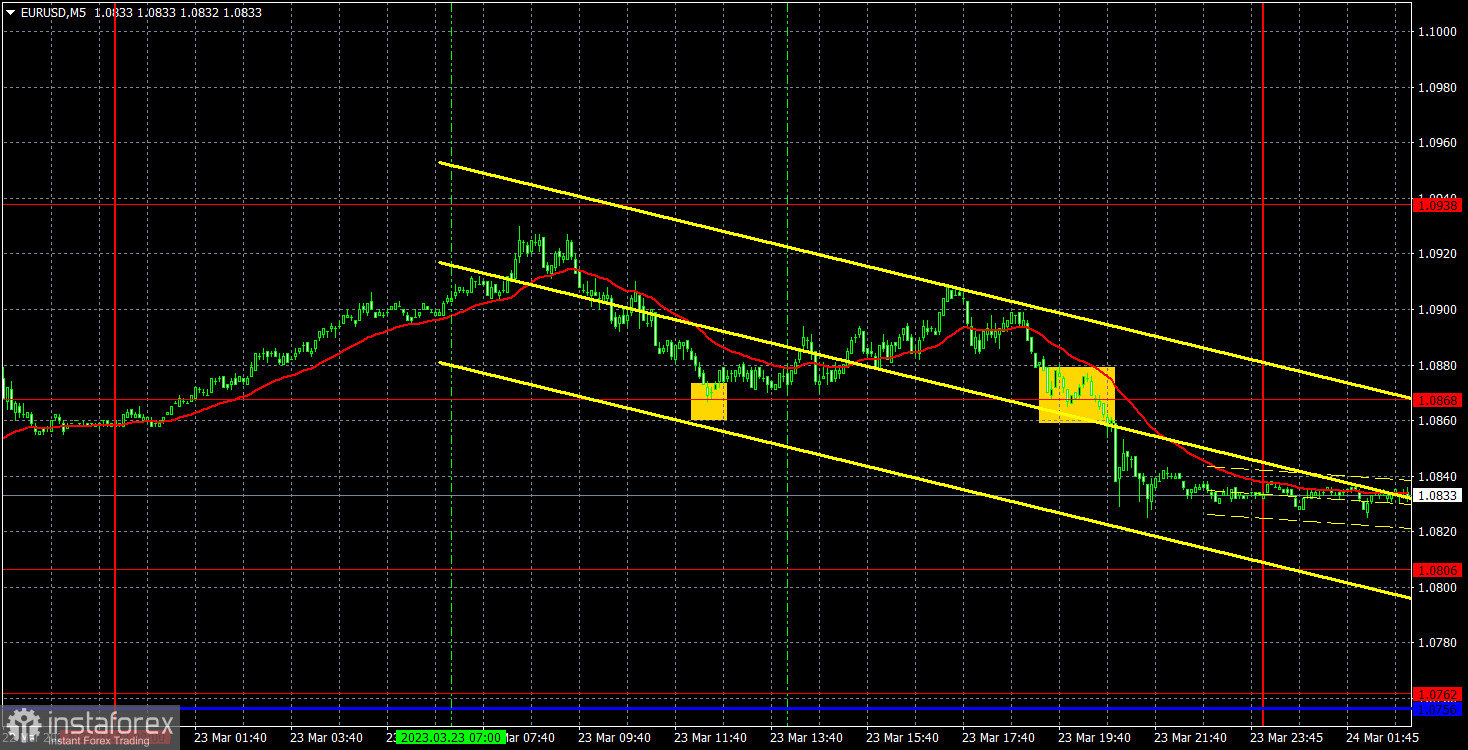
5M chart of EUR/USD
On Thursday, EUR/USD started a bearish correction, but kept the uptrend. All in all, the euro rose for more than 5 days, which was not always justified by the fundamental background. Though, there was enough fundamental background this week as well as last week. Thus, it is quite possible to "explain" the post factum growth of the euro, but I think that the pair should fall instead of rise. Yesterday, there were no interesting events for the euro. In the morning, the pair might have been influenced by the results of the Federal Reserve meeting, but even this morning, it is still difficult to interpret them correctly. Traders initially paid attention to Fed Chairman Jerome Powell's hints that the Fed may stop the rate hike in the near future, and on Thursday, the US dollar rose on the same background. In general, a "swing", which is an illogical reaction of the market with all the consequences.
There were few trading signals. At first, the pair rebounded from 1.0868, and then, closer to the evening, it surpassed this level. Therefore, traders could only use the first signal, after which the pair moved about 25 pips in the right direction. This was enough to set the Stop Loss to Breakeven, but no more. In general, yesterday's volatility was low. Actually, volatility was not high for the entire week, given the strength of the fundamental background.
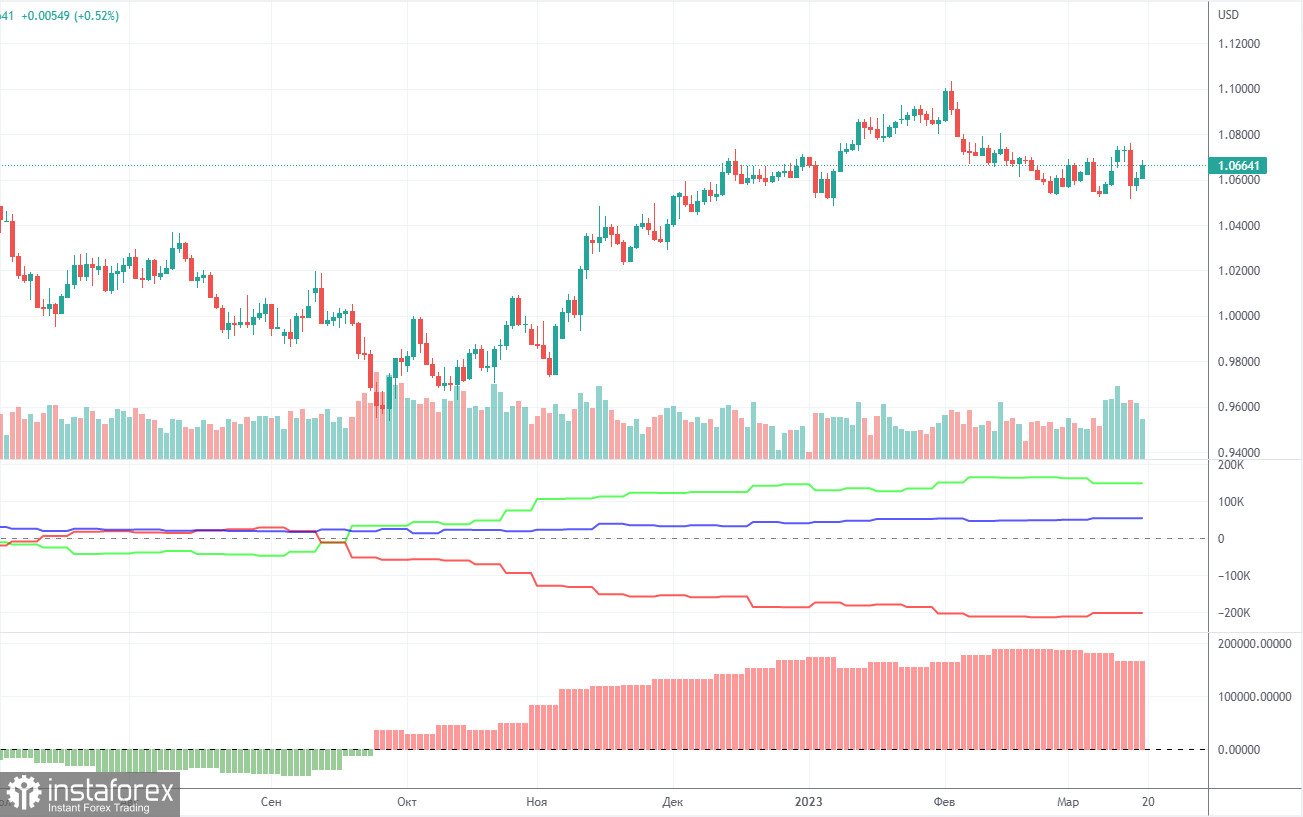
COT report:
On Friday, the new COT report for March 7 was released. The Commodity Futures Trading Commission is slowly catching up with the lost time and publishes reports that have a frequency of two weeks. At this rate, in a couple of weeks we will get the actual data again. So far, we can say that in the last few months, the overall picture has been corresponding to the market situation. On the chart above, we see that the net non-commercial position of large traders (second indicator) has risen since September 2022. At about the same time, the euro started to rise. The net non-commercial position is bullish and only started to fall during the last couple of weeks, which coincides with the euro's decline. I have already drawn your attention to the fact that a fairly high value of the "net position" allows us to expect the uptrend to stop shortly. Such a signal comes from the first indicator, with the green line and the red line being far apart, which is usually a sign of the end of a trend. The euro has already started to fall, but we don't know if it's just a bearish correction or a new downtrend. According to the latest report, non-commercial traders closed 6,900 long positions, while the number of short ones increased by 6,900. Consequently, the net position fell by 13,800. The number of long positions exceeds that of short ones by 148,000. In any case, a correction has been looming for a long time. Therefore, even without reports, it is clear that the downtrend will continue.
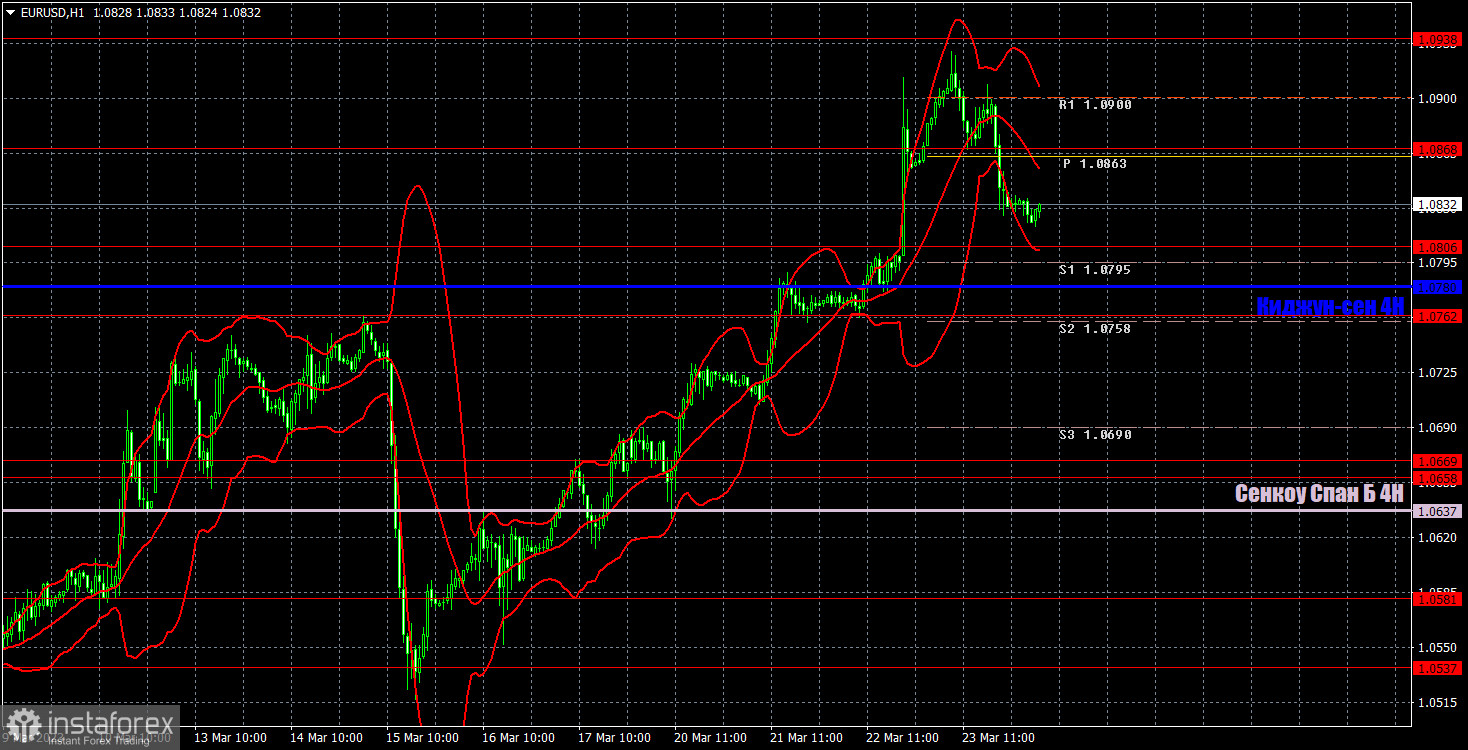
1H chart of EUR/USD
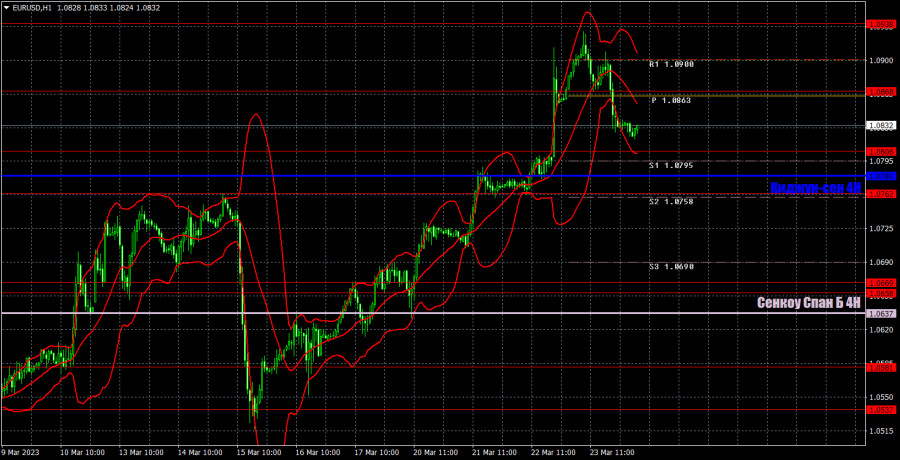
On the one-hour chart, EUR/USD has been rising for six straight days, so now we need at least a slight correction. I still doubt the euro's ability to show growth in the medium-term because there are not so many factors for it. The picture did not become clearer even after the European Central Bank and Federal Reserve meetings, as we did not receive any clear statements about the central bank's plans. On Friday, important levels are seen at 1.0581, 1.0658-1.0669, 1.0762, 1.0806, 1.0868, 1.0938, 1.1033, 1.1137-1.1185, and also Senkou Span B lines (1.0637) and Kijun Sen (1.0780) lines. Ichimoku indicator lines can move intraday, which should be taken into account when determining trading signals. There are also support and resistance although no signals are made near these levels. They could be made when the price either breaks or rebounds from these extreme levels. Do not forget to place Stop Loss at the breakeven point when the price goes by 15 pips in the right direction. In case of a false breakout, it could save you from possible losses. On March 24, the EU and US will release PMIs for services and manufacturing sectors. These are not that important and traders only react to these reports if the actual value strongly deviates from the expected one. In the US, hawkish Fed representative James Bullard will give his speech and we also have the Durable Goods report.
Indicators on charts:
Resistance/support - thick red lines, near which the trend may stop. They do not make trading signals.
Kijun-sen and Senkou Span B are the Ichimoku indicator lines moved to the hourly timeframe from the 4-hour timeframe. They are also strong lines.
Extreme levels are thin red lines, from which the price used to bounce earlier. They can produce trading signals.
Yellow lines are trend lines, trend channels, and any other technical patterns.
Indicator 1 on the COT chart is the size of the net position of each trader category.
Indicator 2 on the COT chart is the size of the net position for the Non-commercial group of traders.