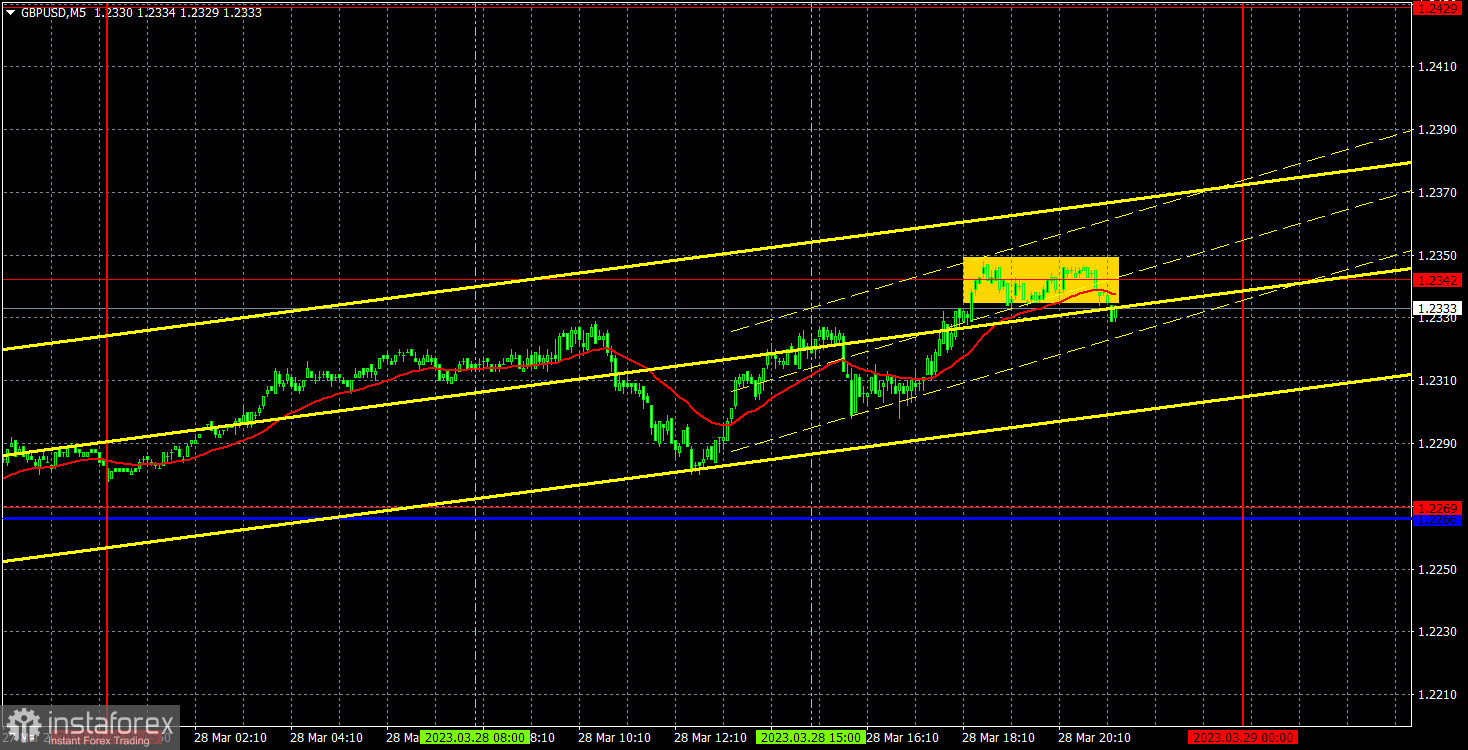
empty
29.03.2023 08:01 AM
GBP/USD: Forecast and trading signals on March 29. COT report. Detailed analysis of price movement and trades. The pound could form a "double top"

5M chart of GBP/USD

This image is no longer relevant

On Tuesday, GBP/USD returned to 1.2342. So far, there has been no breakthrough. This means that the pair could rebound and form a "double top" pattern, which in turn will allow us to expect the pound's decline. It is still important for the pair to overcome the uptrend line, but consolidating above 1.2342 will cross everything out. So now everything depends on 1.2342. Bank of England Governor Andrew Bailey's two speeches on Monday and Tuesday did not give any crucial new information to the traders, but they could detect some hawkish notes. Bailey admitted that the central bank will continue to hike rates, but suggests that rates shouldn't rise to pre-crisis high. Consequently, the range of 5-5.25% seems like the most possible peak for the time being. However, that was already clear even without Bailey's speeches, given the current level of inflation in the UK.

The first trading signal was formed in the middle of the US trading session. This was the time when traders had to think about leaving the market. However, this signal did not form until the evening, so traders should not have opened any positions on Tuesday if they listened to my advice.

COT report:

This image is no longer relevant

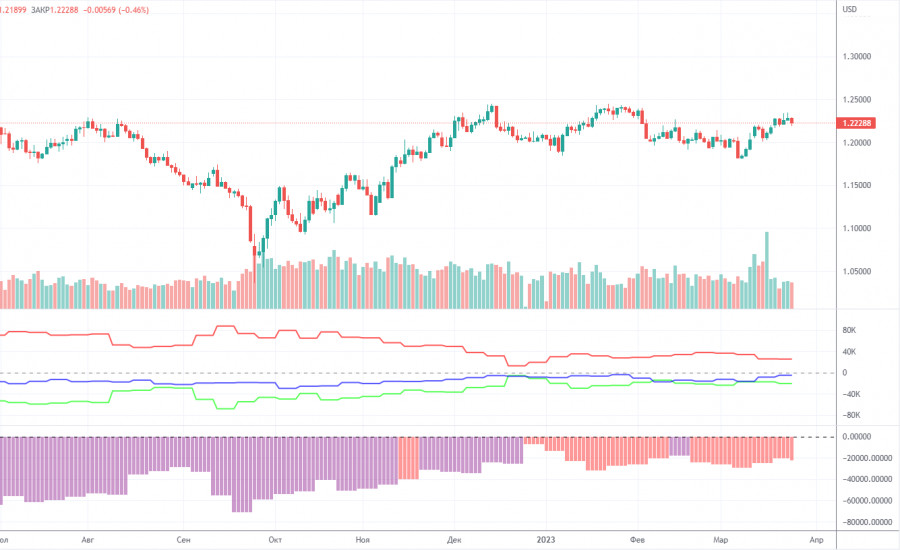
For the British pound, the Commodity Futures Trading Commission has caught up with the lost time and has now released reports exactly on time. The last report available is for March 21. According to that report, the non-commercial group closed 3,700 long positions and 500 short ones. Thus, the net position of non-commercial traders decreased by 3,200 but continues to grow. The net position indicator has been steadily growing over the past months but the mood of major traders still remains bearish. Although the pound sterling is growing against the dollar (in the medium term), it is very difficult to answer the question why it is doing this from a fundamental point of view. It is quite possible that the pound sterling may slump in the near future. Formally, it has already begun its downward movement but so far it looks more like a flat. Notably, both major pairs are moving similarly at the moment. However, the net position for the euro is positive and even implies the imminent completion of the upward momentum, whereas for the pound it is negative, which gives rise to expectations of further growth. But at the same time, the pound has already grown by 2100 points, which is a lot, and without a strong bearish correction the continuation of the growth will be absolutely illogical. The non-commercial group opened a total of 49,000 shorts and 28,000 longs. We remain skeptical about the long-term growth in the British currency and expect it to fall deeper.
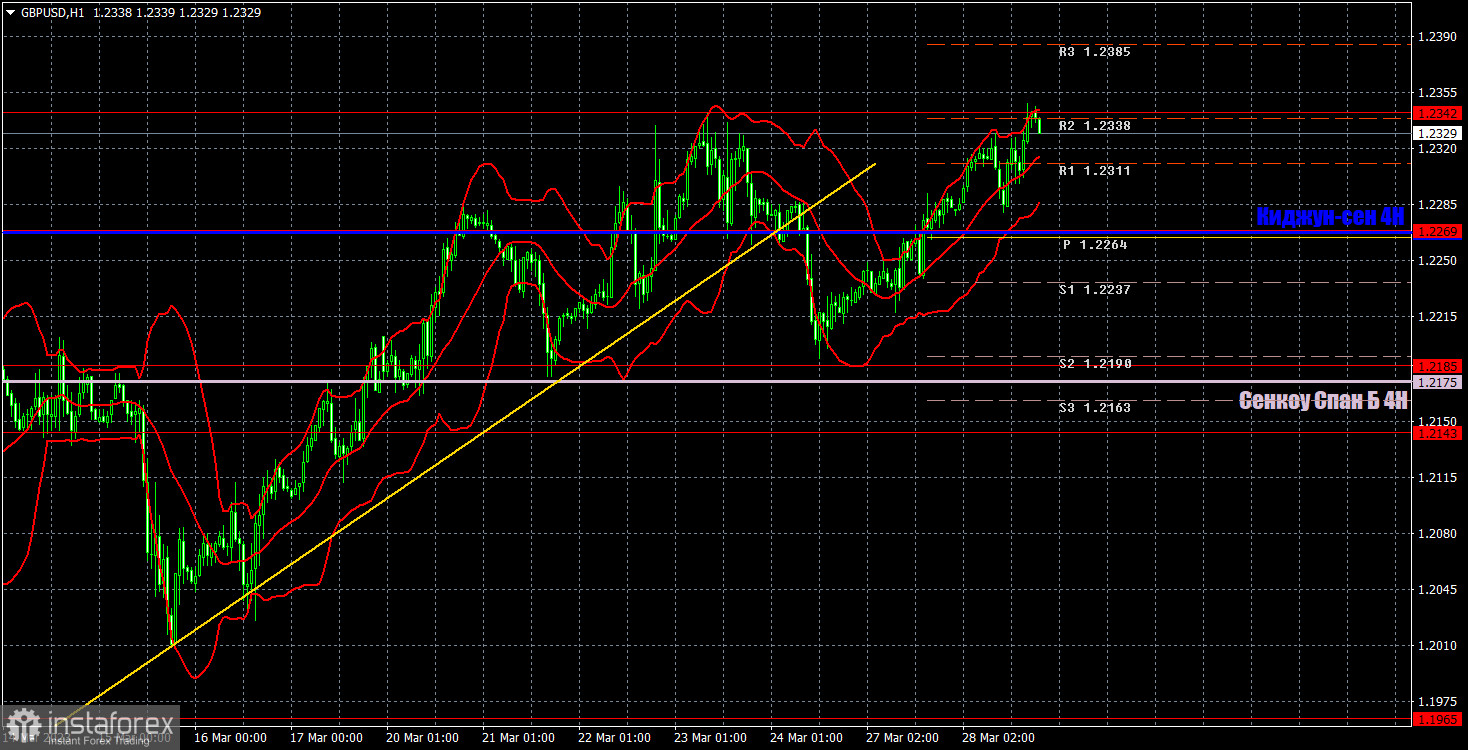
1H chart of GBP/USD

This image is no longer relevant

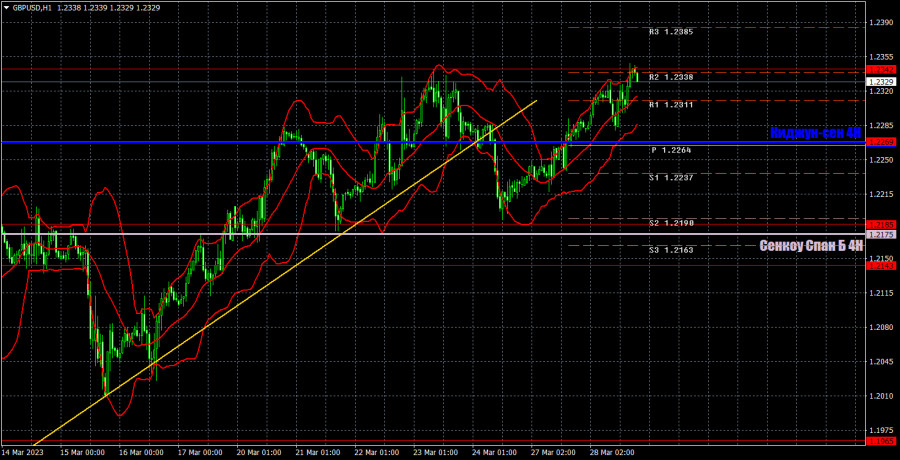
On the one-hour chart, GBP/USD has overcome the trend line, but it has already consolidated above the critical line and it seems that it is ready to resume the uptrend. Therefore, even a strong sell signal can't help pull down the pair just yet. The pound doesn't even need the support of a fundamental background. Only one more rebound from 1.2342 may trigger a new fall, which would be quite logical. On March 29, it is recommended to trade at the key level of 1.1927, 1.1965, 1.2143, 1.2185, 1.2269, 1.2342, 1.2429-1.2458, 1.2589. The Senkou Span B (1.2175) and Kijun Sen (1.2269) lines can also generate signals. Rebounds and breakouts from these lines can also serve as trading signals. It is better to set the Stop Loss at breakeven as soon as the price moves by 20 pips in the right direction. The lines of the Ichimoku indicator can change their position throughout the day which is worth keeping in mind when looking for trading signals. On Wednesday, there are no more important events planned for the UK, but the pound is doing fine without them. In the US, the calendar of macroeconomic events is also absolutely empty. Thus, volatility is unlikely to rise and the nature of the pair's movement will change.

Indicators on charts:

Resistance/support - thick red lines, near which the trend may stop. They do not make trading signals.

Kijun-sen and Senkou Span B are the Ichimoku indicator lines moved to the hourly timeframe from the 4-hour timeframe. They are also strong lines.

Extreme levels are thin red lines, from which the price used to bounce earlier. They can produce trading signals.

Yellow lines are trend lines, trend channels, and any other technical patterns.

Indicator 1 on the COT chart is the size of the net position of each trader category.

Indicator 2 on the COT chart is the size of the net position for the Non-commercial group of traders.

Paolo Greco,
Analytical expert of InstaForex
© 2007-2025
Select timeframe
5
min
15
min
30
min
1
hour
4
hours
1
day
1
week
Earn on cryptocurrency rate changes with InstaForex
Download MetaTrader 4 and open your first trade
  • Grand Choice
    Contest by
    InstaForex
    InstaForex always strives to help you
    fulfill your biggest dreams.
    JOIN CONTEST

Recommended Stories

Trading Recommendations and Analysis for GBP/USD on May 22: The Pound Breaks Through Key Levels

The GBP/USD currency pair also resumed its upward movement on Wednesday. The rise of the British pound, which in reality still reflects the fall of the US dollar, began overnight

Paolo Greco 03:30 2025-05-22 UTC+2

Trading Recommendations and Analysis for EUR/USD on May 22: Reasons Don't Matter and Aren't Needed

The EUR/USD currency pair resumed its upward movement on Wednesday, and it is now safe to say that the uptrend is present not only in the hourly timeframe but also

Paolo Greco 03:30 2025-05-22 UTC+2

How to Trade the GBP/USD Pair on May 21? Simple Tips and Trade Analysis for Beginners

Analysis of Tuesday's Trades 1H Chart of GBP/USD The GBP/USD pair mainly traded sideways on Tuesday, but early Wednesday morning it surged upward. On the 4-hour timeframe, it's clear that

Paolo Greco 06:17 2025-05-21 UTC+2

How to Trade the EUR/USD Pair on May 21? Simple Tips and Trade Analysis for Beginners

Analysis of Tuesday's Trades 1H Chart of EUR/USD On Tuesday, the EUR/USD currency pair traded sideways, but it resumed its upward movement early Wednesday morning. This indicates that the ongoing

Paolo Greco 06:17 2025-05-21 UTC+2

Trading Recommendations and Analysis for GBP/USD on May 21: The British Pound Remains in a Flat Range

The GBP/USD currency pair continued to trade within the boundaries of a sideways channel on Tuesday, which has existed for over a month and is clearly visible. While on Monday

Paolo Greco 03:48 2025-05-21 UTC+2

Trading Recommendations and Analysis for EUR/USD on May 21: The Euro Continues to Climb

The EUR/USD currency pair mostly traded sideways throughout Tuesday. Unlike Monday, traders had no formal reason to sell the dollar, something they've been doing frequently lately. As a reminder, Monday's

Paolo Greco 03:48 2025-05-21 UTC+2

How to Trade the GBP/USD Pair on May 20? Simple Tips and Trade Analysis for Beginners

Analysis of Monday's Trades 1H Chart of GBP/USD Throughout Monday, the GBP/USD pair continued its upward movement, and at first glance, it might seem that a new uptrend is forming

Paolo Greco 05:40 2025-05-20 UTC+2

How to Trade the EUR/USD Pair on May 20? Simple Tips and Trade Analysis for Beginners

Analysis of Monday's Trades 1H Chart of EUR/USD The EUR/USD currency pair surged upward on Monday with renewed strength. But what justified this move, given that Monday's macroeconomic and fundamental

Paolo Greco 05:40 2025-05-20 UTC+2

Trading Recommendations and Analysis for GBP/USD on May 20: The Pound Keeps Seizing Every Opportunity

The GBP/USD currency pair continued its upward movement on Monday, which began last week. The price successfully broke through both Ichimoku indicator lines, so from a technical standpoint, the trend

Paolo Greco 04:09 2025-05-20 UTC+2

Trading Recommendations and Analysis for EUR/USD on May 20: The Dollar Is Looking for Reasons to Fall

The EUR/USD currency pair showed a relatively substantial rise on Monday. We believe there was no macroeconomic or fundamental justification for such a sharp depreciation of the U.S. dollar that

Paolo Greco 04:09 2025-05-20 UTC+2
Can't speak right now?
Ask your question in the chat.
Widget callback
 

Dear visitor,

Your IP address shows that you are currently located in the USA. If you are a resident of the United States, you are prohibited from using the services of InstaFintech Group including online trading, online transfers, deposit/withdrawal of funds, etc.

If you think you are seeing this message by mistake and your location is not the US, kindly proceed to the website. Otherwise, you must leave the website in order to comply with government restrictions.

Why does your IP address show your location as the USA?

  • - you are using a VPN provided by a hosting company based in the United States;
  • - your IP does not have proper WHOIS records;
  • - an error occurred in the WHOIS geolocation database.

Please confirm whether you are a US resident or not by clicking the relevant button below. If you choose the wrong option, being a US resident, you will not be able to open an account with InstaForex anyway.

We are sorry for any inconvenience caused by this message.