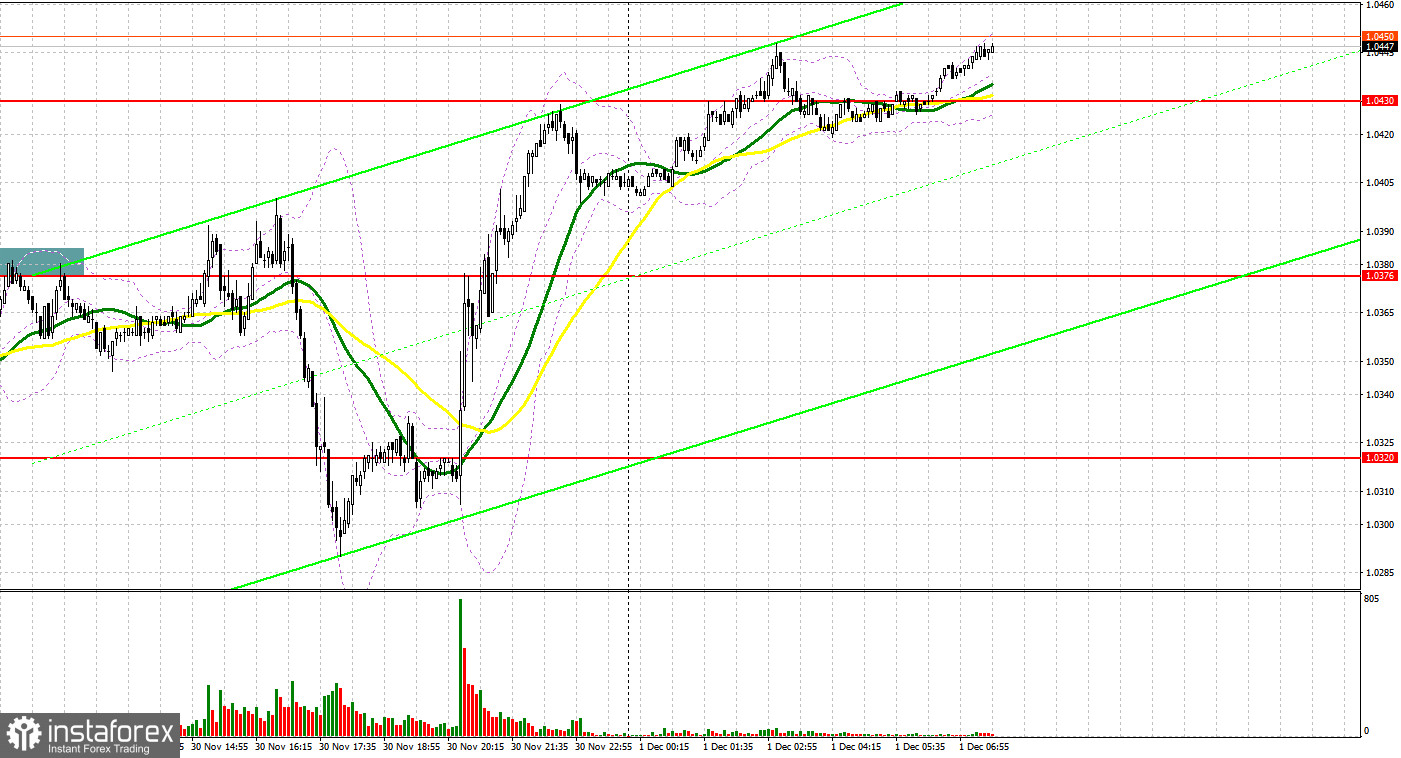
Yesterday, there was only one entry signal. Let us have a look at the 5-minute chart and figure out what happened. In my morning forecasted, I highlighted the level of 1.0376 and recommended making decisions with this level in mind. The pair went up and performed a false breakout of this level in the first half of the day, creating two excellent sell signals. The latest eurozone inflation data put pressure on the European currency, sending the pair down by more than 30 pips. There were no signals to enter the market in the second half of the day, despite the high volatility.
When to open long positions on EUR/USD:
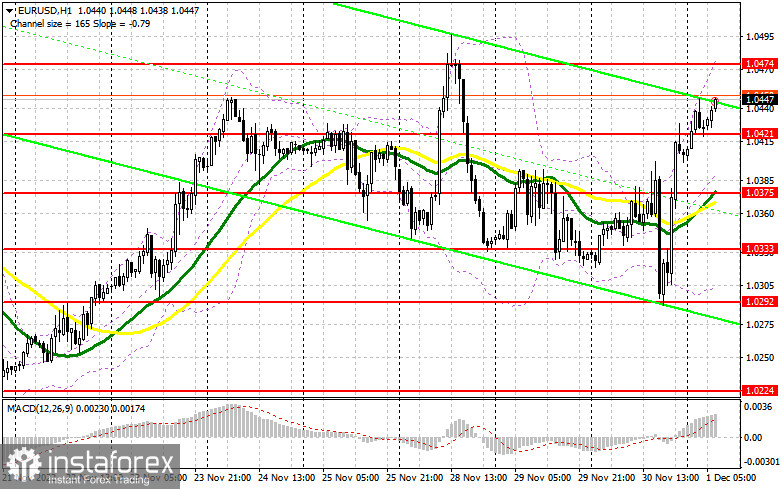
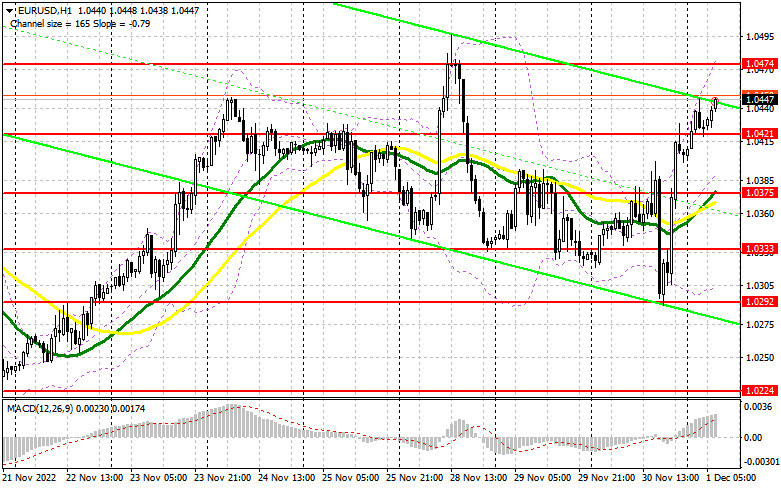
Yesterday, Fed Chairman Jerome Powell signaled that the Federal Reserve would slow the pace of interest rate hikes next month, while stressing that borrowing costs would continue to rise and will remain high for some time to beat high inflation. These statements pushed the dollar down sharply, especially after the ADP labor market data indicated new jobs dropped sharply. Some data is released this morning, but it is unlikely to give strong support to the European currency. However, if the bulls manage to handle the pressure, the euro could take another leap upwards. German retail sales data, Eurozone manufacturing PMI and unemployment data are also coming up. If the pair declines on these data releases, a false breakout at the closest support at 1.0421 will create a buy signal, sending the pair back to 1.0474. A breakout and a downward test of this range will create an additional buy signal. The pair may hit the monthly high at 1.0525 afterwards. A breakout above this level will also trigger Stop Loss orders of bears and create another buy signal. Afterwards, the pair may rally to 1.0568, where I recommend taking profit. This will reinforce the bullish trend and restore upward momentum. If EUR/USD declines and bulls are inactive at 1.0421, the pressure on the pair will increase, which will exacerbate the situation for buyers at the beginning of December. A breakout of 1.0421 will push the pair down to the next support at 1.0375. The moving averages, which are located there, are favorable for bulls. Holding onto this level is necessary for a short-term uptrend to begin. I recommend opening long positions only during a false breakout. You can buy EUR/USD immediately if the pair bounces from 1.0333, or even from 1.0292, keeping in mind an upward intraday correction of 30-35 pips.
When to open short positions on EUR/USD:
The bears did their best, but the Fed Chairman's remarks threw a wrench into their plans. Now, bearish traders await speeches of the ECB Executive Board members Philip Lane and Frank Elderson, who may speak about revising the pace of rate hikes in the eurozone after yesterday's inflation report. This will put pressure on the euro. The best scenario for going short on EUR/USD during the European session is a false breakout of the closest resistance level of 1.0474. The currency is moving towards this level at this point. This will allow opening short positions and may send the currency back to 1.0421, the support level formed at the end of the Asian session. A consolidation below this range could put more pressure on the euro later in the week, leading to a more significant downward correction. A breakout and an upward retest of 1.0421 will create a sell signal. Afterwards, the pair may trigger the Stop Loss orders of bulls and drop deeper to 1.0375, where the moving averages are located. The most distant target will be 1.0333, where I recommend taking profit. A test of this level will put the pair in a sideways channel, which will be a victory for bearish traders in the current situation. If EUR/USD moves up during the European session and there are no bears active at 1.0474, the pair will advance to 1.0525. I also recommend opening short positions there only after an unsuccessful consolidation. It is possible to sell EUR/USD immediately if it bounces from the high of 1.0568, or even from 1.0604, keeping in mind a downward correction of 30-35 pips.
COT report:
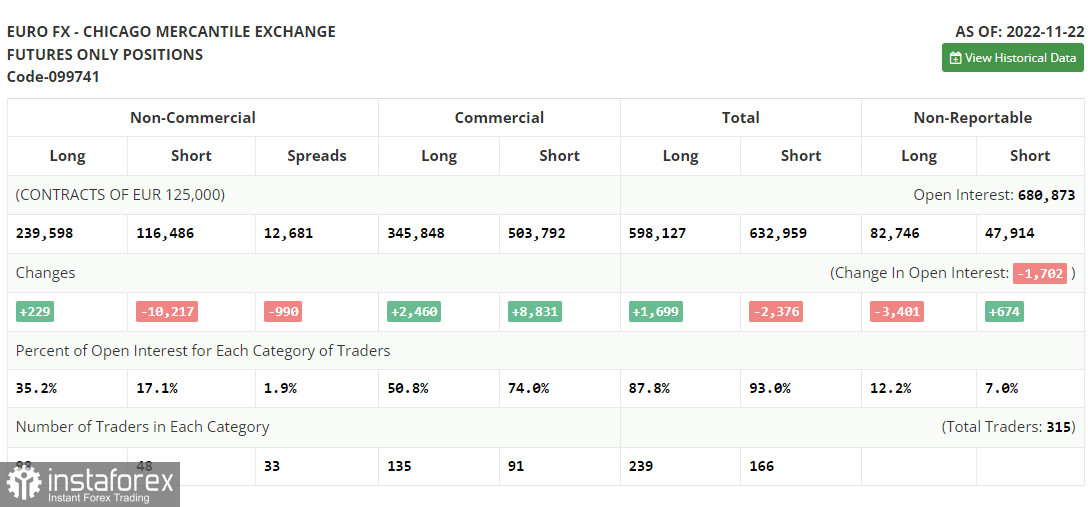
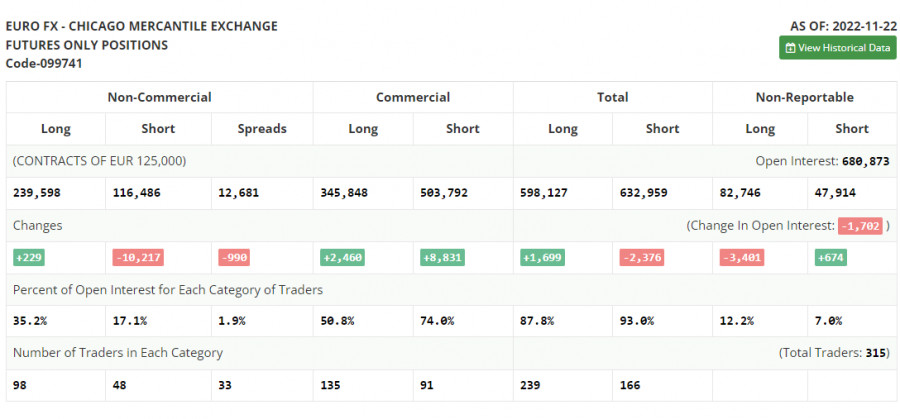
The Commitment of Traders (COT) report for November 22 showed an increase in long positions and a sharp decline in short positions. The statements made by Fed policymakers allowed euro bulls to increase their exposure to EUR, as traders once again became confident that the FOMC would change its aggressive stance on interest rate hikes in the US. Key GDP and U.S. labor market data will be released in the near future, which may help clarify the situation. Afterwards, the inflation data for November will be the only missing piece of the puzzle. The decline in new jobs and rising unemployment would send the US dollar downwards against risky assets, including the euro. It is also worth paying attention to remarks by Fed chairman Powell. If he continues to be hawkish, it will be another reason to go short on the dollar, as further interest rate hikes may push the US economy into a bigger recession. The COT report indicated that long non-commercial positions rose by 229 to 239,598, while short non-commercial positions fell sharply by 10,217 to 116,486. At the end of the week, total non-commercial net positioning increased to 123,112 versus 112,666. This indicates that investors continue to take advantage of the situation and keep buying the cheap euro even above parity, as well as accumulating long positions. They are expecting the crisis to end and the pair to recover in the long run. The weekly closing price fell to 1.0315 vs. 1.0390.
Indicators' signals:
Moving averages
Trading is carried out above 30-day and 50-day moving averages, which indicates that bulls have the advantage in the market.
Note: The period and prices of moving averages are considered by the author on the H1 (1-hour) chart and differ from the general definition of the classic daily moving averages on the daily D1 chart.
Bollinger Bands
If the pair moves up, the upper boundary of the indicator at 1.0474 will serve as resistance. If EUR/USD declines, the lower boundary of the indicator around 1.0330 will act as support.
Description of indicators
• Moving average (moving average, determines the current trend by smoothing out volatility and noise). Period 50. It is marked yellow on the chart.
• Moving average (moving average, determines the current trend by smoothing out volatility and noise). Period 30. It is marked green on the chart.
• MACD indicator (Moving Average Convergence/Divergence - convergence/divergence of moving averages) Quick EMA period 12. Slow EMA period to 26. SMA period 9
• Bollinger Bands (Bollinger Bands). Period 20
• Non-commercial speculative traders, such as individual traders, hedge funds, and large institutions that use the futures market for speculative purposes and meet certain requirements.
• Long non-commercial positions represent the total long open position of non-commercial traders.
• Short non-commercial positions represent the total short open position of non-commercial traders.
• Total non-commercial net position is the difference between the short and long positions of non-commercial traders.