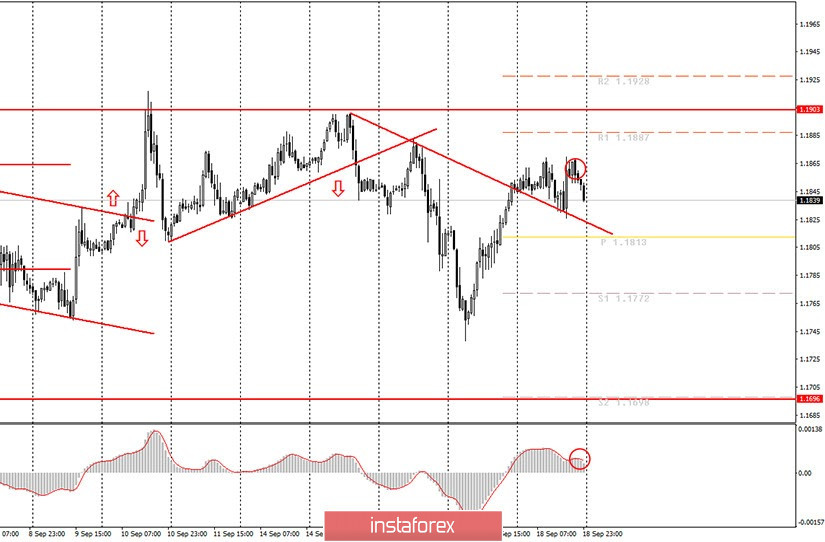
Hourly chart of the EUR/USD pair
The EUR/USD pair tried to start a new round of downward movement within the 1.1700-1.1900 channel on Friday, September 18. There were two attempts. The first was unsuccessful, and it is too early to draw conclusions on the second. The downward movement began on Friday, but did not last long, as trades were closed. Unfortunately for novice traders, the overall technical picture on Friday did not become clear at all. The pair still continues to trade in the 1.17-1.19 horizontal channel, but there were internal trend channels and trend lines earlier, from time to time, and now there is nothing like that. The movements have become more chaotic and "ragged" in the last few days. The last trend line, which we talked about in recent reports, could provide a sell signal, but did not do so. Therefore, it has already been canceled, and there are still no new technical patterns. In general, trading is now extremely difficult, especially for novice traders. You can trade at your own peril and risk only on one factor. The pair is in the upper area of the horizontal channel once again; therefore, it is much more advisable to sell from here than to buy. Accordingly, you can hypothetically work with each MACD sell signal.
There was practically no fundamental background on Friday. No important and interesting events took place either in America or in the European Union. The markets completely retreated and recovered after the Federal Reserve meeting and eventually they did not understand which way to trade the pair. There was also not a single macroeconomic report during the day that deserved the attention of traders. The Michigan Institute's Consumer Confidence Index was released in the US in the afternoon, which exceeded forecasted values and reached 78.9. However, just as expected, it had no effect on the pair's movement.
Fed Chairman Jerome Powell is set to deliver a speech on Monday, September 21. His last speech could be interpreted in different ways, since the theses that he voiced are not unambiguous and do not relate to the current state of the economy and its prospects. Simply put, market participants have not yet understood what to expect from the Fed in the future. There are only two options here: 1) further easing of monetary policy (bearish factor for the dollar); 2) unchanged monetary policy for several years. The Fed may still use other instruments to stimulate the economy even if the key rate does not go down any more. Or, at least, to declare the need for new stimulation of the economy. Traders are interested in this kind of information. And you can see for yourself that Powell's speech from last Wednesday had no effect on the dollar, even over several days.
Possible scenarios for September 21:
1) Novice traders are still not recommended to place buy positions at this time, since the price failed to overcome the 1.1903 level once again, which is the upper line of the horizontal channel. In addition, there is not a single serious pattern that would support the upward trend now. Lastly, quotes are currently in the upper area of the horizontal channel, in which it is more logical to consider sell positions.
2) Selling still looks more attractive now, since traders have not overcome the 1.1903 level. Thus, novice traders may consider opening new short positions on a new sell signal from the MACD indicator while aiming for 1.1813 and 1.1772. However, keep in mind that all signals from MACD alone will be interpreted as weak. There is no trend line or channel. It is better to wait until morning to open new positions on Monday.
On the chart:
Support and Resistance Levels are the Levels that serve as targets when buying or selling the pair. You can place Take Profit near these levels.
Red lines are the channels or trend lines that display the current trend and show in which direction it is better to trade now.
Up/down arrows show where you should sell or buy after reaching or breaking through particular levels.
The MACD indicator (10,20,3) consists of a histogram and a signal line. When they cross, this is a signal to enter the market. It is recommended to use this indicator in combination with trend lines (channels and trend lines).
Important announcements and economic reports that you can always find in the news calendar can seriously influence the trajectory of a currency pair. Therefore, at the time of their release, we recommended trading as carefully as possible or exit the market in order to avoid a sharp price reversal.
Beginners on Forex should remember that not every single trade has to be profitable. The development of a clear strategy and money management are the key to success in trading over a long period of time.