You require the following to open long positions on EUR/USD:
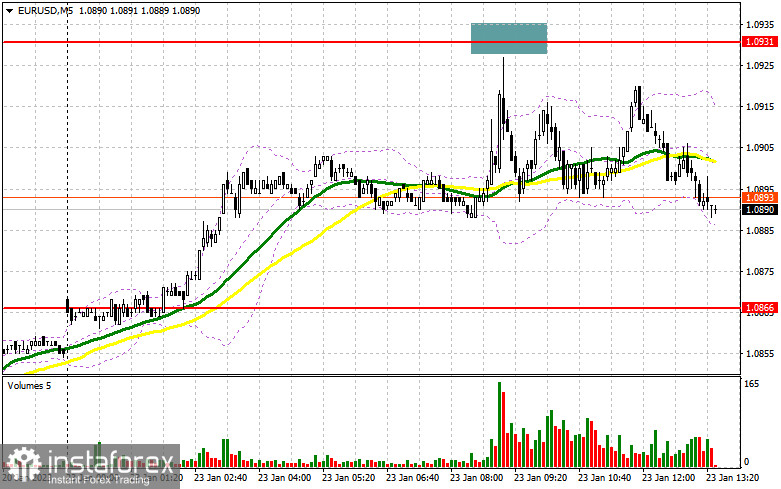
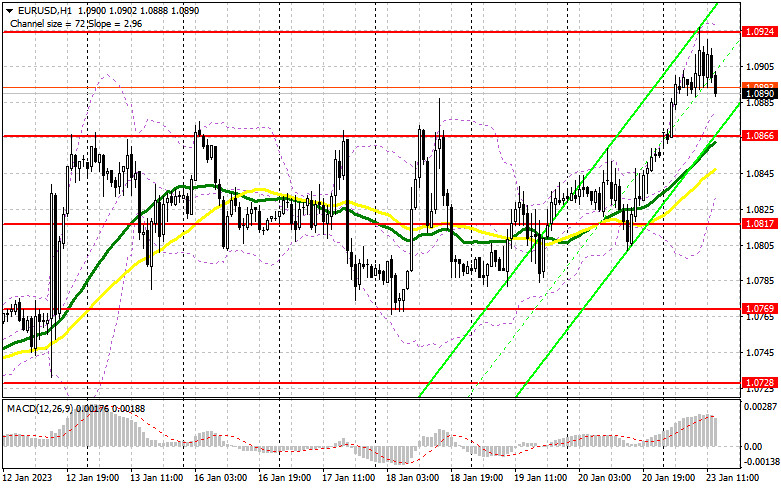
In my morning forecast, I focused on the level of 1.0931 and offered recommendations based on it for market entry decisions. Let's analyze the 5-minute chart to see what transpired there. The market was not very volatile, so a false breakdown at this level never formed. The bulls attempted to reach 1.0931, but they lacked sufficient strength to do it. The technical situation and the tactic itself have not changed for the second half of the day.
There are no market-moving statistics during the American session, and information regarding the index of leading economic indicators in the US will undoubtedly be disregarded. Because of this, I encourage you to proceed as planned. I will wait for the pair to move down to the area of 1.0866 and only start opening long positions from there after the development of a false breakdown. The area of 1.0931, which we have not yet achieved, will be the target. Only after dismal US data and aggressive remarks from Christine Lagarde, president of the European Central Bank, will this range be broken and tested from the top down, providing another entry point for accumulating long positions with a move to 1.0970. When this level is broken, the stop orders for the bears are also struck, creating a second signal that could lead to a move to 1.1007, where I will fix the profit. With the possibility of a decline in EUR/USD and the lack of buyers at 1.0866, a more significant euro correction could start in the afternoon. This is because a return to 1.0866, where the moving averages are currently favoring the bulls, would thwart buyers' attempts to establish a new bullish trend. The next support at 1.0817, which serves as the midpoint of the side channel from last week, will therefore receive the most attention. The only indication to buy the euro will be the development of a false breakdown there. For a rebound from the low of 1.0769, or even lower, around 1.0728, I will begin long positions right away with the goal of an upward correction of 30-35 points during the day.
You require the following to open short positions on EUR/USD:
The bears' focus is still on this level, specifically because they haven't yet been able to return to 1.0866. Although it is unlikely that anything will depend on US data, as I mentioned above, market volatility may slightly increase as a result of the ECB members' statements. To move back to 1.0817, a breakout and a reverse test of 1.0866 from the bottom up will suggest a sell signal. A consolidation below this band will result in a larger decline to the area of 1.0769, which will bring back the bear market. I'll set the profit there. If the EUR/USD moves higher during the American session, I encourage you to pay particular attention to sales near the new high of 1.0924, which was established after the conclusion of the European session. If a false breakdown forms there, it will be a hint that short positions should be opened. I will prefer to take short positions only from the new resistance of 1.0970 if we do not witness an active decline from 1.0924 in the afternoon. Additionally, it makes sense to watch for ineffective consolidation and a phony breakdown. On the bounce from the all-time high of 1.1007, I will sell the EUR/USD pair right away with an eye on a 30- to 35-point retracement to the downside.
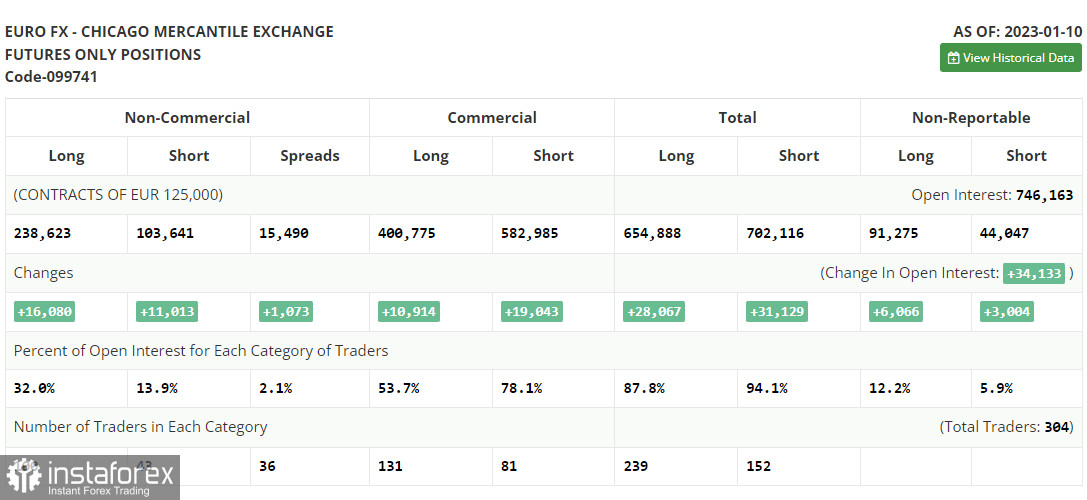
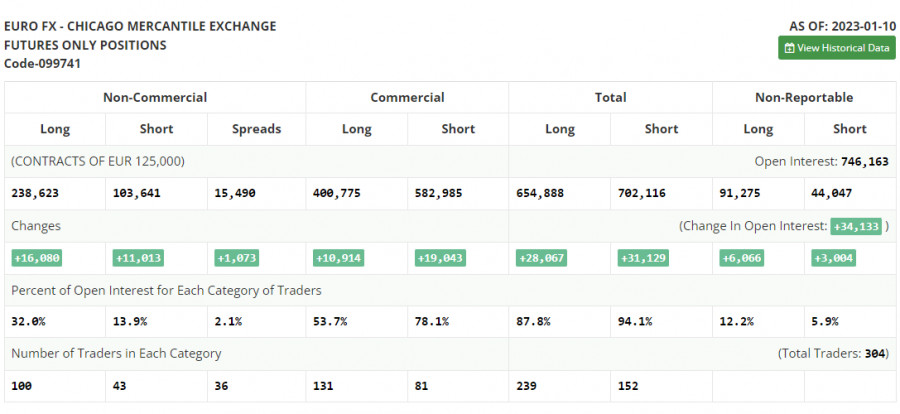
Both long and short positions saw a significant increase, according to the January 10 COT report (Commitment of Traders). After the New Year's break and the announcement of inflation numbers showing a slowdown in the rate of price growth in the United States in December this year, it is clear that traders are returning to the market. The US dollar is negatively impacted by this arrangement and loses ground against the euro because the Federal Reserve System can only raise interest rates by 0.25% at its meeting in February, which is terrible for the economy and the US dollar. The slowdown in aggressive US policies is bringing back a desire for risk, which is increasing demand for hazardous assets and making assets whose prices have plummeted over the past year quite appealing. It is now vital to keep an eye on the remarks made by Federal Reserve System officials and make some inferences about the likely direction the committee will take in February of this year. According to the COT data, the number of long non-commercial positions increased by 16,080, to 238,623, while the number of short non-commercial positions increased by 11,013, to 103,641. The total non-commercial net position rose to 134,982 from 129,915 after the week. All of this shows that investors are still buying euros with the assumption that this year's harsh central bank measures will ease; nonetheless, a new fundamental justification is required for the euro to continue to expand positively. The weekly ending price increased from 1.0617 to 1.0787.
Signals from indicators
Moving Averages
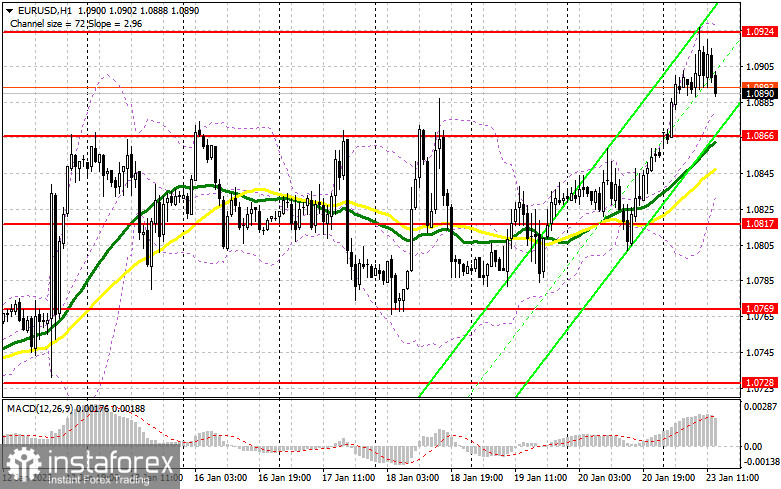
Trading is taking place above the 30- and 50-day moving averages, which suggests an effort to keep the euro's gain going.
Note that the author's consideration of the period and cost of moving averages on the hourly chart H1 differs from the standard definition of the traditional daily moving averages on the daily chart D1.
Bands by Bollinger
The indicator's upper limit, which is located at 1.0924, will serve as resistance in the event of expansion.
Description of indicators
- Moving average (moving average determines the current trend by smoothing out volatility and noise). Period 50. The graph is marked in yellow.
- Moving average (moving average determines the current trend by smoothing out volatility and noise). Period 30. The graph is marked in green.
- MACD indicator (Moving Average Convergence / Divergence - moving average convergence/divergence) Fast EMA period 12. Slow EMA period 26. SMA period 9
- Bollinger Bands (Bollinger Bands). Period 20
- Non-profit speculative traders, such as individual traders, hedge funds, and large institutions, use the futures market for speculative purposes and to meet certain requirements.
- Long non-commercial positions represent the total long open position of non-commercial traders.
- Short non-commercial positions represent the total short open position of non-commercial traders.
- Total non-commercial net position is the difference between the short and long positions of non-commercial traders.