For EUR/USD long positions, the following is required:
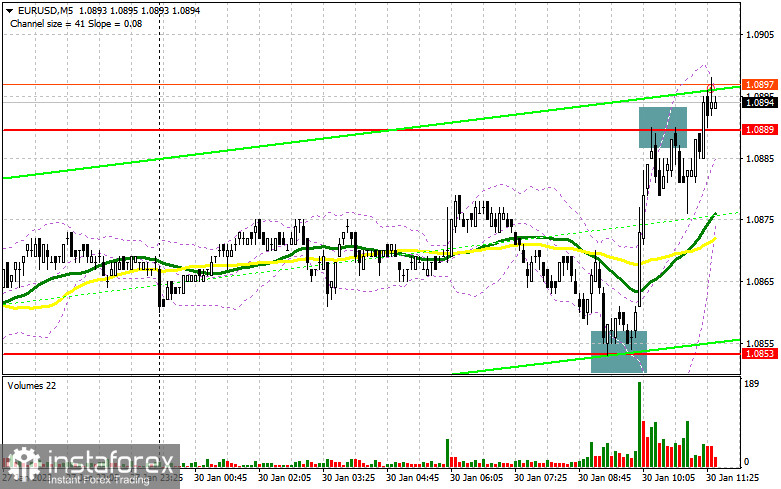
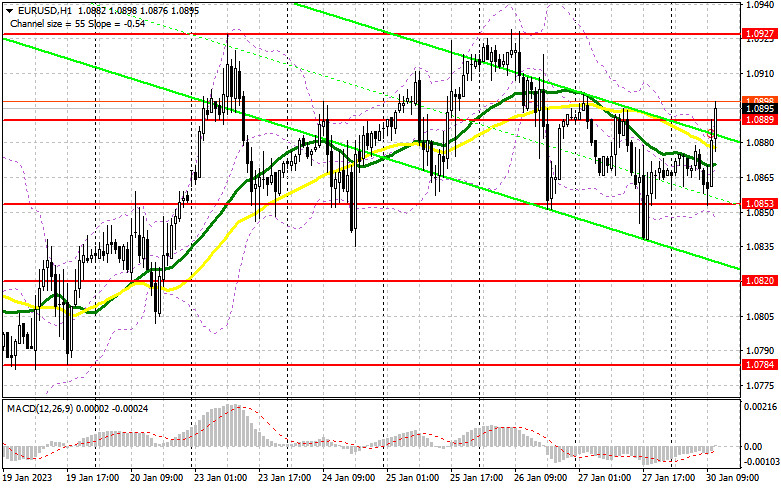
In my morning article, I turned your attention to 1.0853 and recommended making decisions at this level. Now, let's look at the 5-minute chart and figure out what happened. As I mentioned in my morning article, the decrease to the level of 1.0853 took place against the backdrop of negative statistics for Germany. Following that, a false breakout and a buy signal were formed, leading to a return to 1.0889 and the chance to gain about 30 points of profit. A false breakout around 1.0889 created a sell signal. The technical situation was left unchanged for the rest of the day.
Nothing could change the trend of the market during the American session, so if the euro doesn't start to actively rise soon, I believe the pair will reverse course and begin to decrease once more in the afternoon. I'm still going to buy euros when they go down. A signal to open long positions will be provided by the emergence of a false breakout at 1.0853. These positions, like the morning trade, should be realized reasonably quickly. The resistance level of 1.0889, which has yet to be overcome, will be the target. This range may be broken. Its top-down test forms a second point of entry for developing long positions with a movement of 1.0927. The bears' stop orders will also be hit if this level is broken, adding another signal and the potential for a move to 1.0969, where I will take profits. If there are no buyers at 1.0853 and the EUR/USD falls, or if there is no active increase from this level at a false breakout in the afternoon, I suggest you stop buying. The following support at 1.0820 will be the main focus. The only indication to buy the euro will be the development of a false breakout. With an eye toward a 30- to 35-point upward corrective during the day, I will open long positions right away for a rebound from the low of 1.0784, or even lower, around 1.0735.
You need the following to open short positions on EUR/USD:
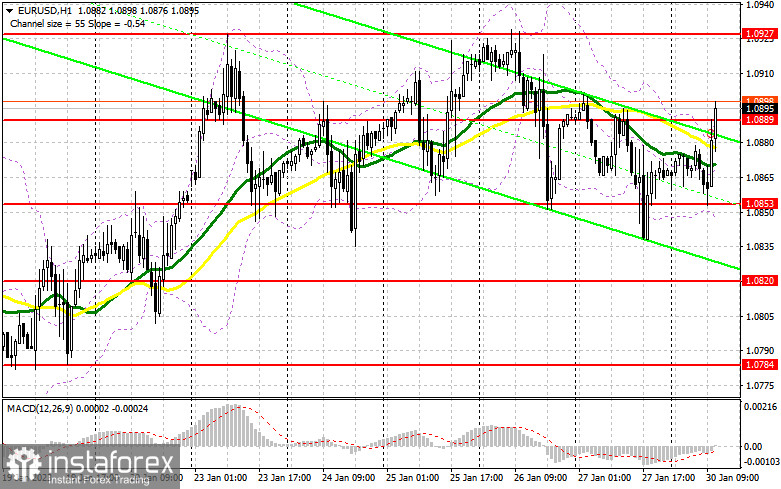
The bears have completed their tasks by keeping the euro below 1.0889. Additionally, it stayed above 1.0853 without consolidating. The likelihood of a decline in the euro will continue up until the point when trading is done below 1.0889. Although the demand for the euro may be supported for a while by the lack of US statistics and aggressive euro buyers anticipating future rate increases by the European Central Bank, I advise you to reconsider sales if there isn't an active move above 1.0889 and a return to this level by the middle of the American session. The target will be 1.0853, and if it is broken, you will be able to receive a sell signal to return to 1.0820. A consolidation below this level will result in a larger decline to the area of 1.0784, which will bring back the bear market. If the EUR/USD increases during the American session and there are no sellers above 1.0889, I encourage you to pay closer attention to sales near the monthly high of 1.0927. There will be a false breakout that will develop, providing a great entry point. I will prefer to take short positions only from the new resistance of 1.0969 if we do not observe an active decline from 1.0927. Additionally, it makes sense to look for ineffective consolidation and a false breakout. On the rebound from the all-time high of 1.1006, I will sell the EUR/USD pair right away with an aim toward a 30- to 35-point downward correction.
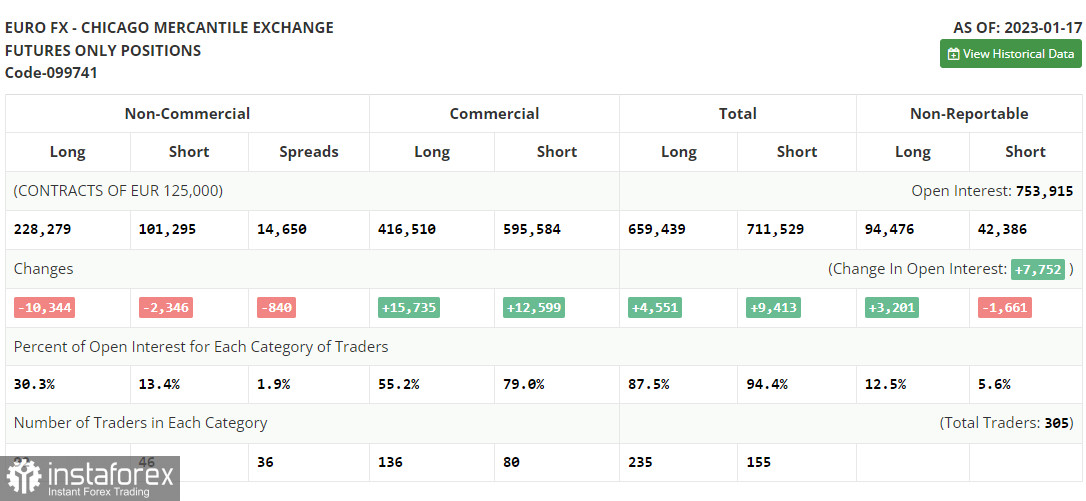
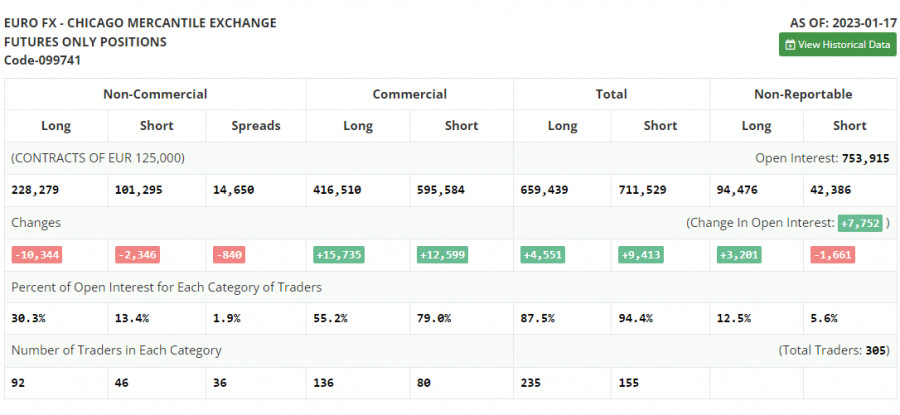
Let's take a look at what occurred in the futures market and how the positions of Commitment of Traders have changed before discussing the prospects for the EUR/USD movement in the future. Both long and short positions decreased as of January 17, according to the COT report (Commitment of Traders). After the active growth of the euro ahead of the Federal Reserve System meeting, which will take place next week, it is clear that traders are beginning to adopt a wait-and-see position once more. Recent releases of quite poor fundamental data on the US economy, particularly on the decrease in retail sales in December of last year, indicate that the situation is still getting worse and that the Fed's current aggressive approach may further impair the economy. On the other hand, inflation is still declining, which gives us time to reevaluate the rate and future level of interest rates. The euro is also being supported by ECB officials, who frequently reiterate the necessity of additional strong rate increases to confidently defeat inflation, aiding EUR/USD in updating monthly highs. According to the COT data, long non-commercial positions fell by 10,344 to a total of 228,279, while short non-commercial positions fell by 2,346 to a total of 101,295 positions. The total non-commercial net position was lower after the week, down from 134,982 to 126,984. All of this shows that investors are awaiting more clarity from the central bank on future interest rates, even though they believe in the euro's continued growth. In contrast to 1.0787, the weekly closing price increased to 1.0833.
Signals from indicators
Moving Averages
Trading occurs in the area of the 30- and 50-day moving averages, which suggests market uncertainty.
Notably, the author considers the time and prices of moving averages on the hourly chart H1 and differs from the standard definition of the traditional daily moving averages on the daily chart D1.
Bands by Bollinger
The indicator's lower limit, which is located around 1.0850, will serve as support in the event of a decline.
An explanation of the indicators
• Moving average (moving average, determines the current trend by smoothing volatility and noise). Period 50. It is marked in yellow on the chart.
• Moving average (moving average, determines the current trend by smoothing volatility and noise). Period 30. It is marked in green on the graph.
• MACD indicator (Moving Average Convergence / Divergence - moving average convergence/divergence) Fast EMA period 12. Slow EMA period 26. SMA period 9
• Bollinger Bands (Bollinger Bands). Period 20
• Non-profit speculative traders, such as individual traders, hedge funds, and large institutions that use the futures market for speculative purposes and meet certain requirements.
• Long non-commercial positions represent the total long open position of non-commercial traders.
• Short non-commercial positions represent the total short open position of non-commercial traders.
• The total non-commercial net position is the difference between the short and long positions of non-commercial traders.