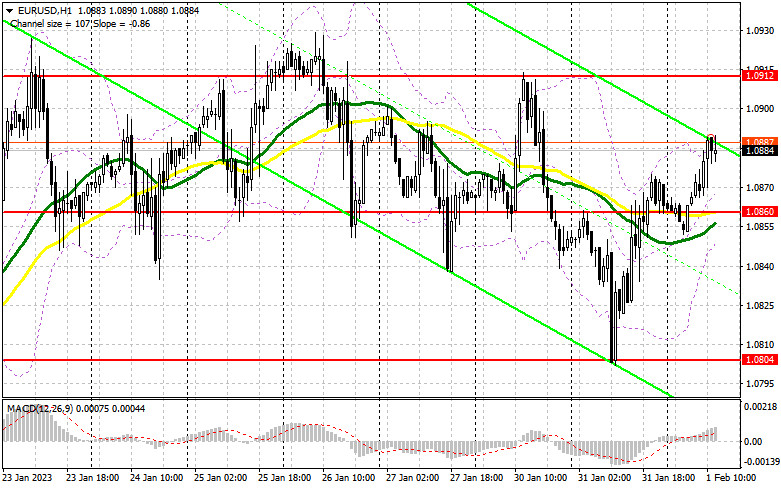
In my morning review, I mentioned the level of 1.0874 as a possible entry point. Let's see what happened on the 5-minute chart. A rise to this level and its false breakout created a good entry point into short positions but later in the day, it became clear that bears have little chance of success. Fresh data revealing that inflation in the eurozone continued to decline had no effect on the market volatility. A breakout and a downward retest of 1.0874 made traders close their short positions and enter into long ones which are still relevant at the time of writing. The technical setup has not changed much in the second half of the day.
For long positions on EUR/USD:
The US Federal Reserve will announce its decision on interest rates later during the North American session. The FOMC is expected to raise the rate by 25 basis points, bringing it to 4.75%. This will indicate a slowdown in the aggressive fight against inflation which will limit the upside potential of the US dollar. If so, the euro may surge to the upside. If Jerome Powell's comments reveal his hawkish stance, let's hope that market participants will believe him. Otherwise, the euro will again beat its rival. Before the Fed's meeting, markets will also take notice of other important publications. Thus, the US ADP employment report is forecast to show moderate growth which is another bearish factor for the greenback. It seems that on the back of this news, the ISM manufacturing index will be of minor importance to traders. If the pair declines, a false breakout at the 1.0860 level which coincides with the moving averages will give a good entry point for going long. In this case, the price may jump further to test the resistance of 1.0912 that was retested in the first half of the day. Given the significance of the Fed meeting, the euro may easily break above this range. Its downward retest will be a good moment to add more long positions on the pair with the upward target at 1.0956. If the pair breaks through this level as well, this will trigger stop-loss orders set by the bears which may push the price higher to 1.1003 where I recommend profit taking. If EUR/USD moves down and bulls are idle at 1.0860 after Powell's statement, it is better to close your long positions. The focus will be shifted to the next support at 1.0804. Only a false breakout at this point will generate a signal to buy the euro. I will open long positions right after a rebound from the low of 1.0770 or 1.0732, keeping in mind an upside correction of 30-35 pips within the day.
For short positions on EUR/USD:
Bears are staying cautious as they anticipate a dovish turn in the Fed's monetary policy. The focus is now on the new resistance at 1.0912 which should be considered when making trading decisions. As long as the pair is trading above 1.0860, bulls will be in control of the market. If the price increases amid the downbeat employment data from the US, only a false breakout at 1.0912 will serve as the first signal to sell the euro. In this case, the new support at 1.0860 will act as a downward target. Its breakout and a downward retest will generate a sell signal with a prospect of falling to the weekly low of 1.0804. The pair may settle below this range after the Fed's meeting is over and continue to extend a downward correction to 1.0770. I'm planning to lock in profit at this point. If EUR/USD advances in the New York session and bears are idle at 1.0912, the market will stay under bullish control. If so, you may consider selling the pair from the high of 1.0956 when a false breakout is formed. If we see no rapid decline from 1.0956, I will open short positions only at the new resistance level of 1.1003. I will sell the pair right after a rebound with the target located 30-35 pips below.
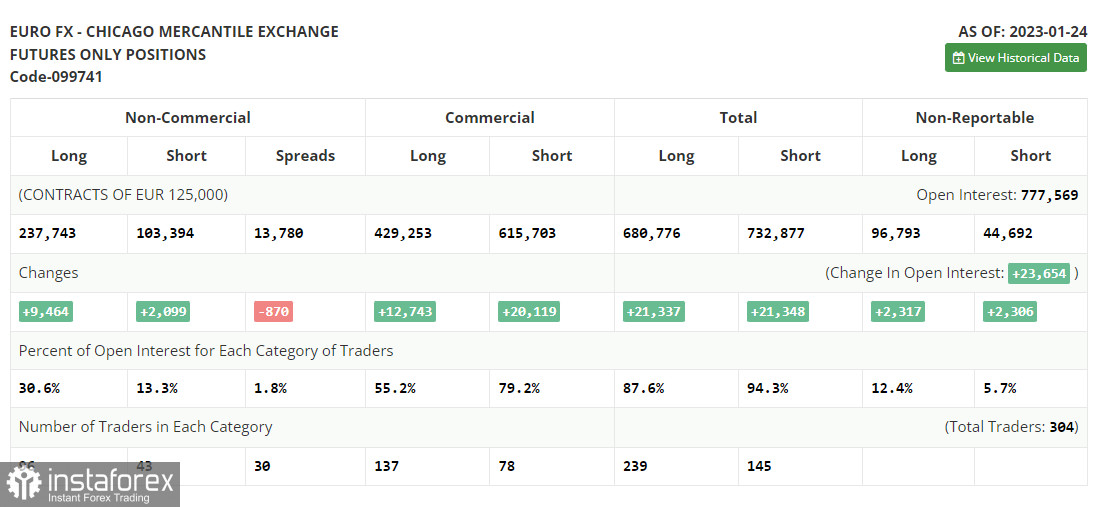
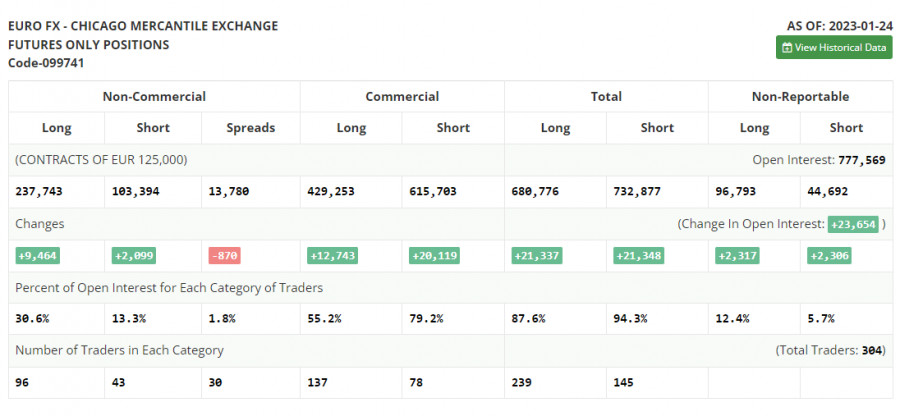
COT report:
The Commitments of Traders report for January 24 shows a rise in both short and long positions. Apparently, traders were encouraged by the ECB statement last week and continued to add more long positions on the pair. They now expect the ECB to maintain its aggressive approach, while the Fed is expected to ease its monetary tightening. The US regulator may reduce the pace of a rate hike for the second time in a row. The recent downbeat data on the US economy, in particular, a drop in retail sales and the easing of inflationary pressure may be a signal for the US central bank to loosen its grip on the economy to avoid any damage. This week is full of central bank meetings that will eventually determine the trajectory of the euro/dollar pair. According to the COT report, long positions of the non-commercial group of traders increased by 9,464 to 237,743 while short positions went up by 2,099 to 103,394. At the end of the week, the total non-commercial net position rose to 134,349 from 126,984. This means that investors believe in the upside potential of the euro but are looking for more clues from central banks regarding interest rates. The weekly closing price advanced to 1.0919 from 1.0833.
Indicator signals:
Moving Averages
Trading above the 30- and 50-day moving averages indicates the prevalence of the euro bulls.
Please note that the time period and levels of the moving averages are analyzed only for the H1 chart, which differs from the general definition of the classic daily moving averages on the D1 chart.
Bollinger Bands
In case of a decline, the lower band of the indicator at 1.0850 will act as support.
Description of indicators:
• A moving average of a 50-day period determines the current trend by smoothing volatility and noise; marked in yellow on the chart;
• A moving average of a 30-day period determines the current trend by smoothing volatility and noise; marked in green on the chart;
• MACD Indicator (Moving Average Convergence/Divergence) Fast EMA with a 12-day period; Slow EMA with a 26-day period. SMA with a 9-day period;
• Bollinger Bands: 20-day period;
• Non-commercial traders are speculators such as individual traders, hedge funds, and large institutions who use the futures market for speculative purposes and meet certain requirements;
• Long non-commercial positions represent the total number of long positions opened by non-commercial traders;
• Short non-commercial positions represent the total number of short positions opened by non-commercial traders;
• The non-commercial net position is the difference between short and long positions of non-commercial traders.