Analyzing Wednesday's trades:
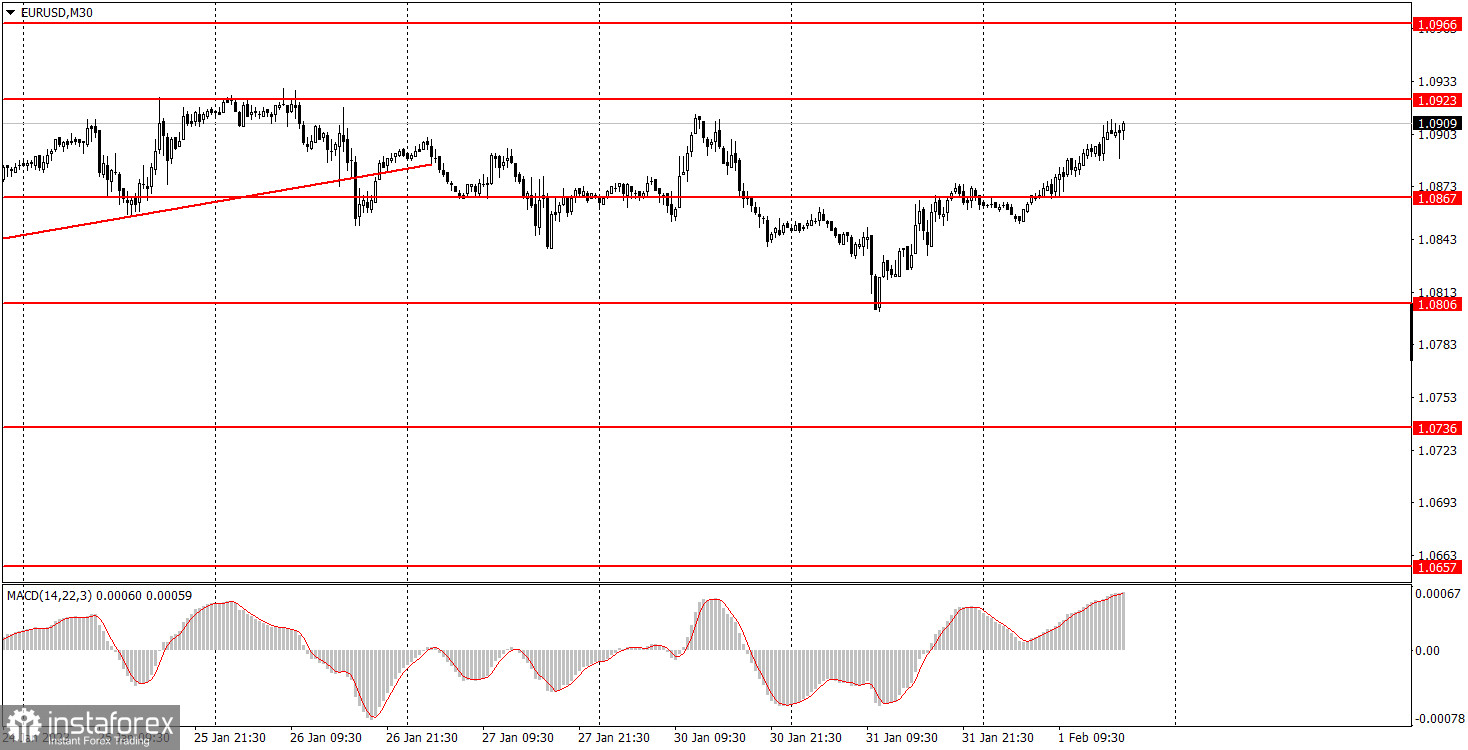
EUR/USD on 30M chart
EUR/USD continued the upward movement that started the day before after the rebound from 1.0806. Thus, the pair remained in the sideways channel of 1.0806-1.0923, in which it has been trading for three weeks. It was approaching the upper limit, after which a rebound and a new round of decline might follow. The Fed announcing the results of its meeting and Fed Chairman Jerome Powell's press conference makes it difficult to predict where the pair will end up. The market reaction could be almost anything. However, I have to emphasize the fact that the euro was unable to correct during the last month. You should also pay attention to the market's reaction to the EU inflation report. Inflation fell more than expected, but the euro continued to grow. I believe that the reaction was absolutely illogical and the volatility of the pair was low, not more than 60 pips, which is strange in itself, considering the strong macroeconomic background.
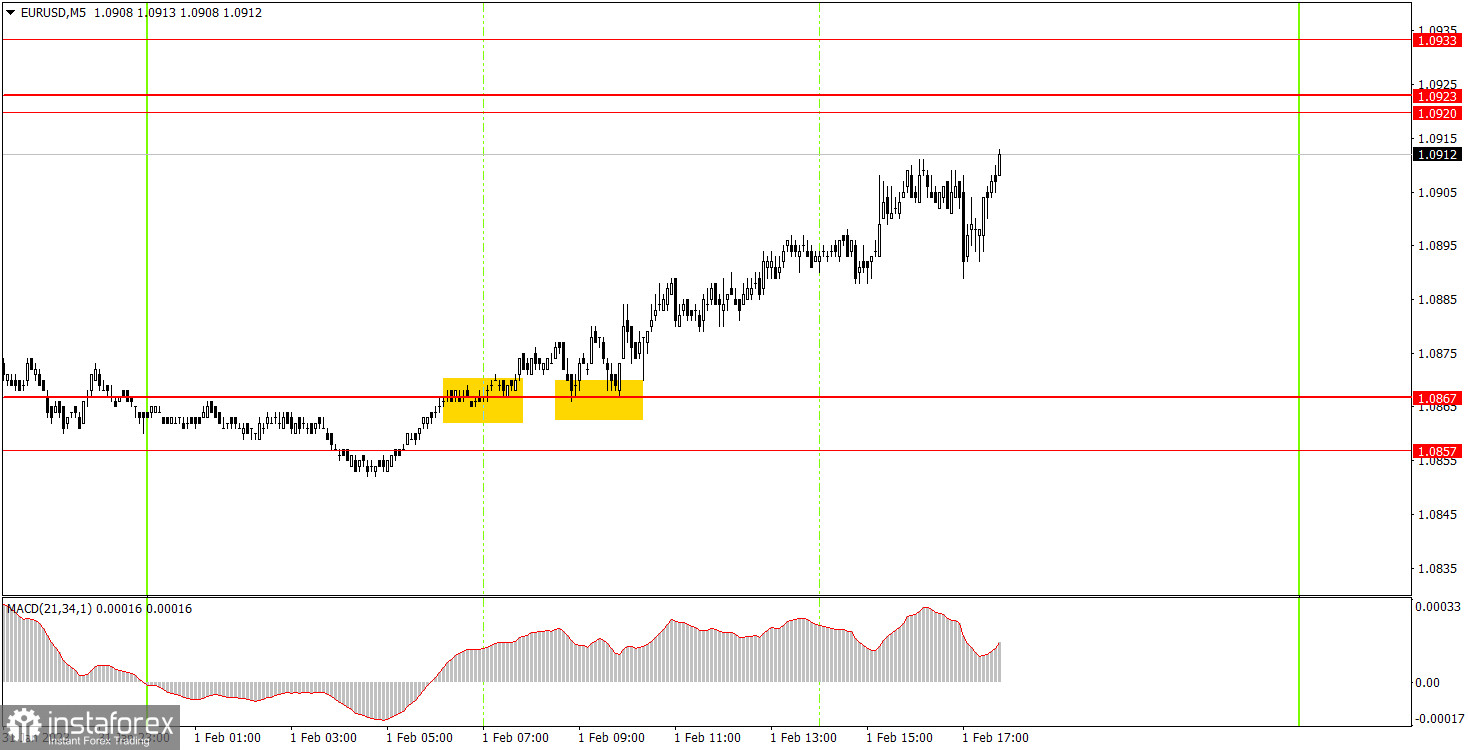
EUR/USD on M5 chart
But the trading signals were in full order on Wednesday. There were three duplicate buy signals at the very beginning of the European trading session, by which at any moment beginners could open one buy position. At the moment, the pair hit 1.0920, so you could lock in profit and calmly wait for the outcome of the Fed meeting. It was possible to earn about 40 pips, which is quite good, taking into account low volatility.
Trading tips on Thursday:
On the 30-minute chart, the pair continues to trade within the sideways channel, but the situation may change dramatically right now or on Thursday evening since the fundamental background at that time will be very strong. Therefore, the pair should be analyzed on Thursday. On the 5-minute chart, it is recommended to trade at the levels 1.0657-1.0668, 1.0697, 1.0736, 1.0768, 1.0806, 1.0857-1.0867, 1.0920-1.0923-1.0933, 1.0966, 1.0989, 1.1038. As soon as the price passes 15 pips in the right direction, you should set a Stop Loss to breakeven. On Thursday, the results of the European Central Bank meeting will be announced and ECB Christine Lagarde will also deliver speeches in the European Union. Reactions could be subdued since the market has already worked out the results of that meeting. At the same time, the results of the Fed meeting will be considered on Thursday. In any case, the pair's movements might be sharp and strong, with frequent reversals. We will only receive secondary data in the US.
Basic rules of the trading system:
1) The strength of the signal is determined by the time it took the signal to form (a rebound or a breakout of the level). The quicker it is formed, the stronger the signal is.
2) If two or more positions were opened near a certain level based on a false signal (which did not trigger a Take Profit or test the nearest target level), then all subsequent signals at this level should be ignored.
3) When trading flat, a pair can form multiple false signals or not form them at all. In any case, it is better to stop trading at the first sign of a flat movement.
4) Trades should be opened in the period between the start of the European session and the middle of the US trading hours when all positions must be closed manually.
5) You can trade using signals from the MACD indicator on the 30-minute time frame only amid strong volatility and a clear trend that should be confirmed by a trendline or a trend channel.
6) If two levels are located too close to each other (from 5 to 15 pips), they should be considered support and resistance levels.
On the chart:
Support and Resistance levels are the levels that serve as targets when buying or selling the pair. You can place Take Profit near these levels.
Red lines are channels or trend lines that display the current trend and show in which direction it is better to trade now.
The MACD indicator (14, 22, and 3) consists of a histogram and a signal line. When they cross, this is a signal to enter the market. It is recommended to use this indicator in combination with trend patterns (channels and trendlines).
Important announcements and economic reports that can be found on the economic calendar can seriously influence the trajectory of a currency pair. Therefore, at the time of their release, we recommend trading as carefully as possible or exiting the market in order to avoid sharp price fluctuations.
Beginners on Forex should remember that not every single trade has to be profitable. The development of a clear strategy and money management is the key to success in trading over a long period of time.