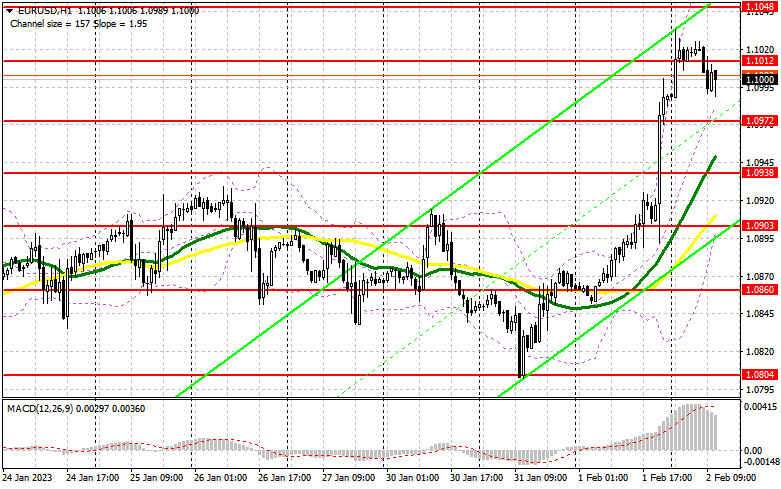
When to open long positions on EUR/USD:
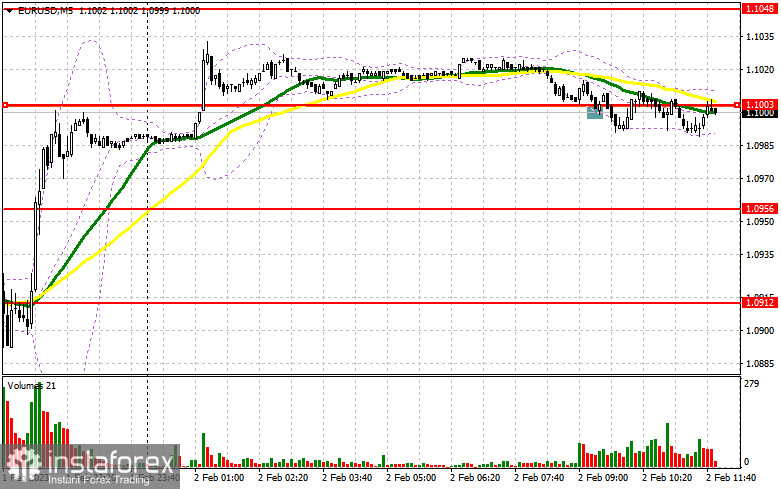
In my morning article, I turned your attention to 1.1003 and recommended making decisions with this level in focus. Now, let's look at the 5-minute chart and figure out what actually happened. Although a decline and a false breakout of this level created the entry point into long positions, the pair was unable to resume a steady upward movement. So, it was possible only to close Stop Loss orders. In the afternoon, the technical outlook was revised completely.
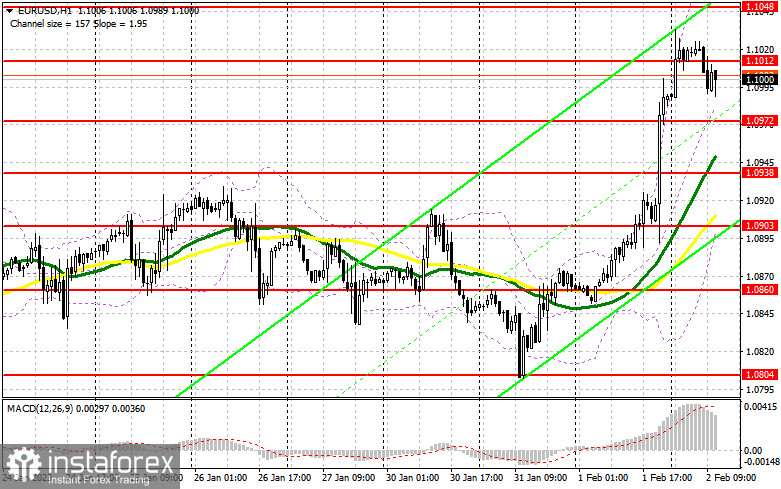
The market is gripped by uncertainty now. However, it is hardly surprising. The euro is unable to resume growth after a correction in the European session. The ECB meeting will take place soon. I've already mentioned how to trade ahead of the meeting in my morning article. If ECB President Christine Lagarde hints at the continuation of monetary tightening, the euro may rise by another 100 pips before the rally ends. If the regulator takes a softer stance, like the Fed pressure on risky assets, including the euro, will escalate. Traders are likely to ignore the US initial jobless claims and factory orders reports as they are mainly focusing on the ECB meeting. In the case of a decline, only a false breakout of 1.0972 will give an entry point into long positions. The par may grow to the resistance level of 1.1012 formed in the morning. A breakout of this level may occur after the ECB meeting. There could also be a downward retest, which will provide a new buying opportunity. The pair is likely to climb to 1.1048. A breakout of this level will force the bears to close their Stop Loss orders, creating an additional buy signal with the possibility of a jump to 1.1089. At this level, I recommend locking in profits. If EUR/USD declines and buyers show no activity at 1.0972, or the pair does not advance after Christine Lagarde's speech, I would advise you to postpone long positions. You should pay attention to the support level of 1.0938 where the moving averages are benefiting the bulls. Only a false breakout there will lead to a buy signal. You could buy EUR/USD at a bounce from the low of 1.0903 or 1.0860, keeping in mind an upward intraday correction of 30-35 pips.
When to open short positions on EUR/USD:
Bears are still hesitant to assert strength. They were able to start a significant correction. However, it seems they don't know what to do next. Everything will depend on the ECB meeting. Sellers are likely to leave the market after it. In the afternoon, I shifted attention to the resistance level of 1.1012. I will make decisions focusing on this level. If the pair grows amid Lagarde's hawkish remakes, only a false breakout of 1.1012 will create the first sell signal. Bears could aim at the support level of 1.0972. A breakout and an upward retest will provide a new sell signal with a decline to a low of 1.0938. The pair may also settle below this level after the ECB meeting. A larger correction to 1.0860 may occur. At this level, I recommend locking in profits. If EUR/USD climbs during the US session and sellers show no energy at 1.1012, which is more likely, buyers will be in control. In this case, I would advise you to open short positions at a high of 1.1048. A false breakout of this level will give an excellent entry point. If the pair does not sink from 1.1048, you could sell EUR/USD at a bounce from the resistance level of 1.1089, keeping in mind a downward intraday correction of 30-35 pips.
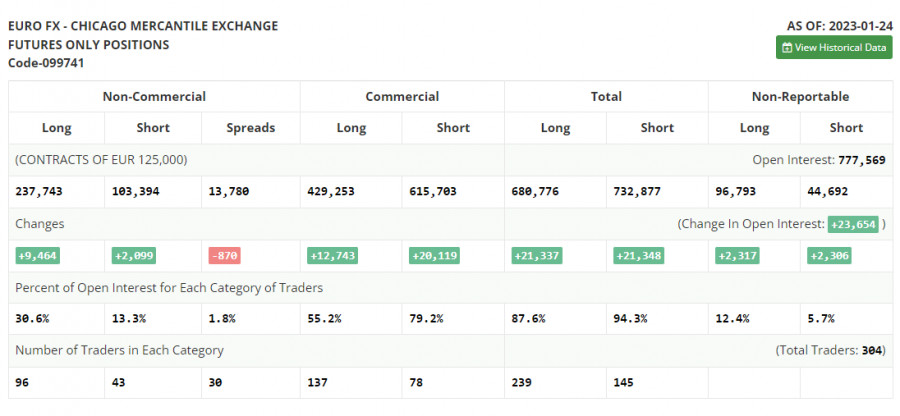
COT report
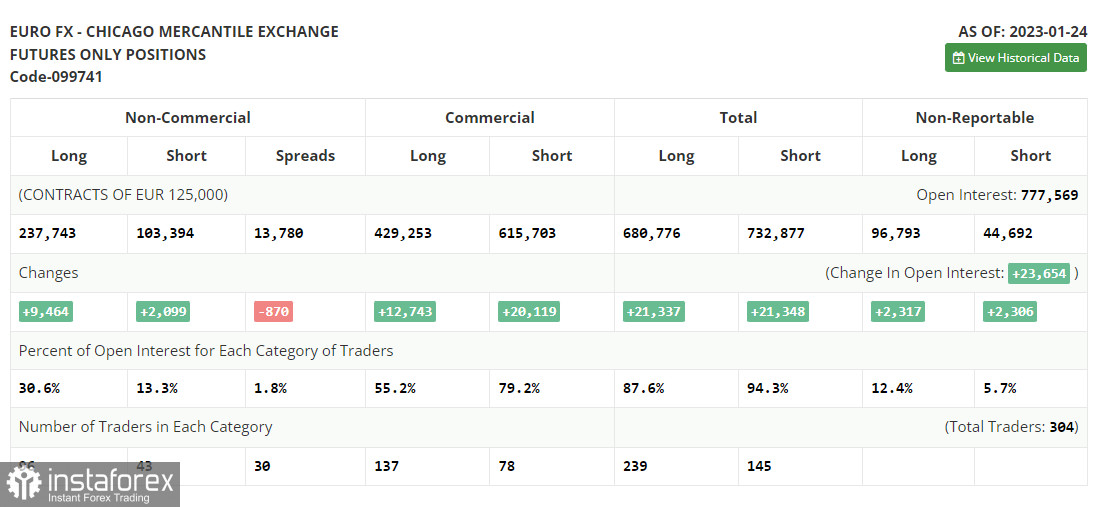
The COT report for January 24 logged a rise in both short and long positions. Traders have significantly increased long positions following hawkish speeches of ECB policymakers. They are betting on further monetary tightening by the ECB and the Fed's dovish stance. The US regulator may reduce the pace of tightening for the second time in a row. Weak macro stats on the US economy, namely a drop in retail sales and a slowdown in inflation may force the central bank to take a pause in rate hikes to avoid any damage. This week, several central banks will hold their meetings. Their results will eventually determine the trajectory of the euro/dollar pair. According to the COT report, long positions of the non-commercial group of traders increased by 9,464 to 237,743 while short positions advanced by 2,099 to 103,394. At the end of the week, the total non-commercial net position rose to 134,349 from 126,984. It appears investors believe in the upside potential of the euro. Nevertheless, they are waiting for more clues from central banks regarding interest rates. The weekly closing price grew to 1.0919 from 1.0833.
Indicators' signals:
Trading is carried out near the 30 and 50 daily moving averages, which indicates a bull market.
Moving averages
Note: The period and prices of moving averages are considered by the author on the H1 (1-hour) chart and differ from the general definition of the classic daily moving averages on the daily D1 chart.
Bollinger Bands
If EUR/USD climbs, the indicator's upper border at 1.1048 will serve as resistance. In case of a decline, the indicator's lower border at 1.0903 will act as support.
Description of indicators
- Moving average (moving average, determines the current trend by smoothing out volatility and noise). Period 50. It is marked yellow on the chart.
- Moving average (moving average, determines the current trend by smoothing out volatility and noise). Period 30. It is marked green on the chart.
- MACD indicator (Moving Average Convergence/Divergence - convergence/divergence of moving averages) Quick EMA period 12. Slow EMA period to 26. SMA period 9
- Bollinger Bands (Bollinger Bands). Period 20
- Non-commercial speculative traders, such as individual traders, hedge funds, and large institutions that use the futures market for speculative purposes and meet certain requirements.
- Long non-commercial positions represent the total long open position of non-commercial traders.
- Short non-commercial positions represent the total short open position of non-commercial traders.
- Total non-commercial net position is the difference between the short and long positions of non-commercial traders.