Analyzing Wednesday's trades:
GBP/USD on 30M chart
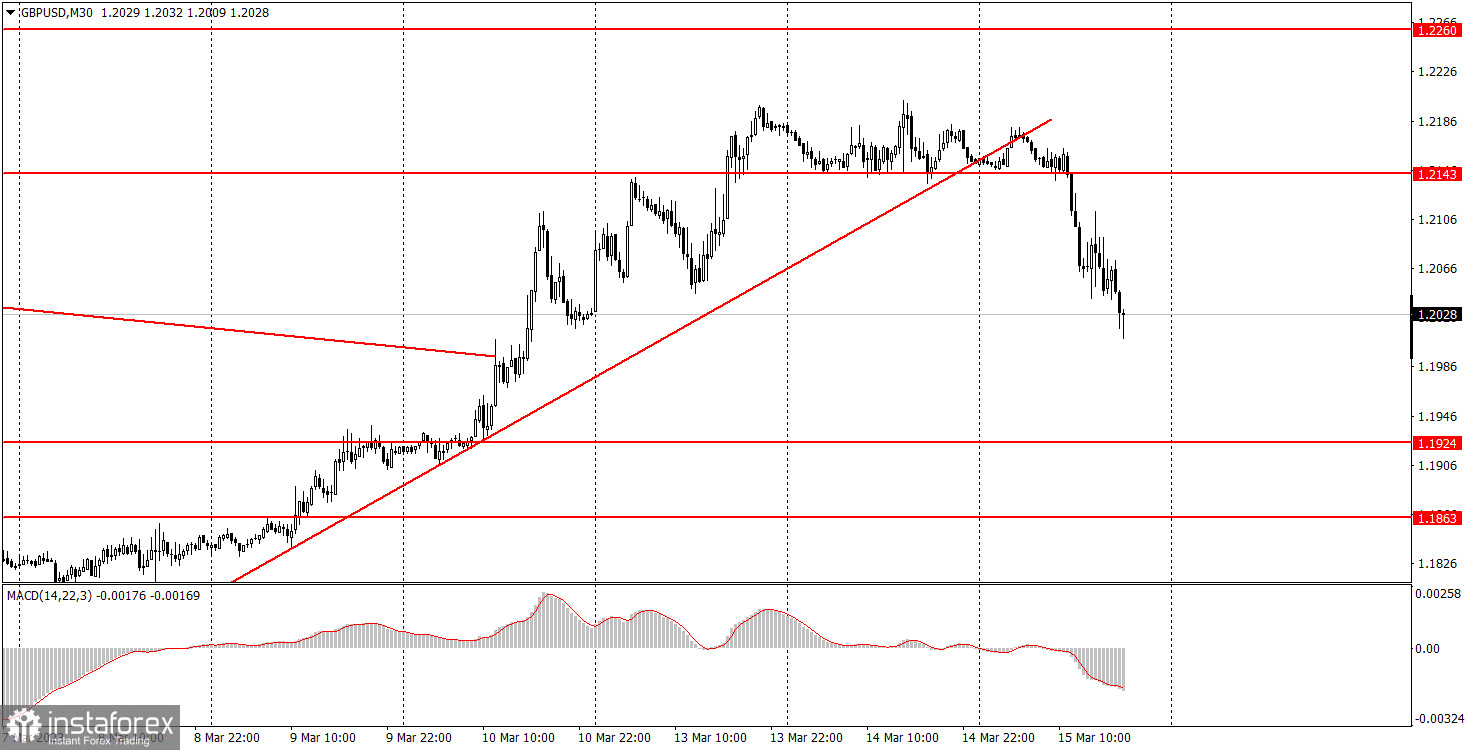
GBP/USD also completed its uptrend on Wednesday. In recent months, there are "swings" on the higher chart, so on the lower chart we see only short-term trends. On Wednesday, the pair has consolidated below the ascending trend line, so a new downtrend has formed at the moment. The reasons why the pound is falling, most likely, are the same as for the euro. The problems of the Swiss bank Credit Suisse have no direct relation to the UK and the pound, but indirectly the euro could pull the British currency down with it. In addition, a new round of downward movement was expected, and we received a technical signal in the form of overcoming the trend line. Now the pound might return to 1.1841, which will leave it inside the horizontal channel on the 1D chart. In the mid-term, I still expect the British currency to fall because there is no serious reason for it to rise.
GBP/USD on 5M chart
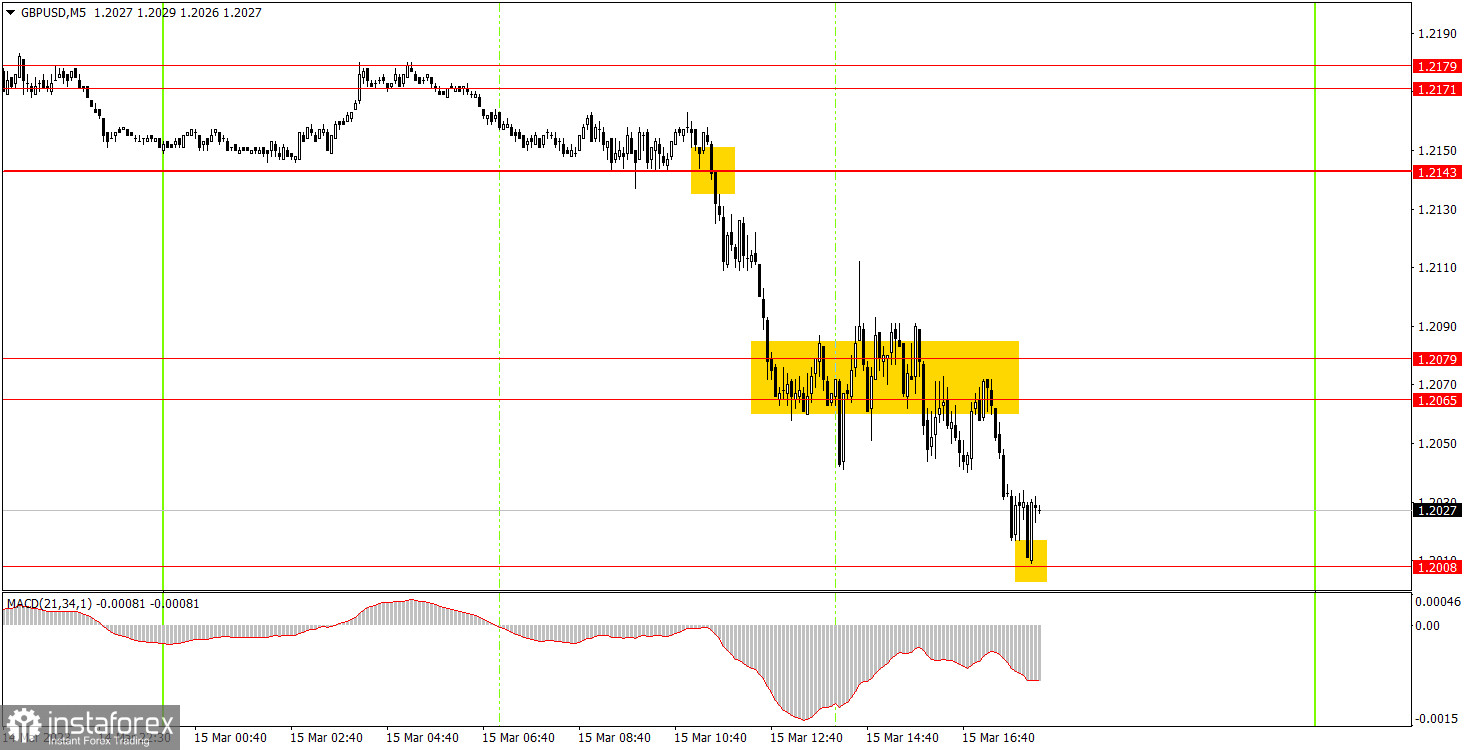
Speaking of trading signals, everything was not simple. At night there was a sell signal around 1.2171-1.2179, and by the opening of the European trading session it was quite possible to open a short position, as the pair moved away from the point where a signal was formed. But the nearest target level of 1.2143 was very close, so there was a great risk of a new flat. And when the pair broke through 1.2143, it was possible to open short positions. Unfortunately, the "dancing and singing" started in the area of 1.2065-1.2079 and there was a false signal. Therefore, beginners could leave shorts, having gained about 40 pips. The buy signal resulted in a loss. The new sell signal on overcoming the 1.2065-1.2079 turned out to be profitable since the price fell to 1.2008 by the evening. In general, the day was not bad, in terms of profit.
Trading tips on Thursday:
On the 30-minute chart, GBP/USD has already ended another uptrend, so it may continue to fall in the coming days. Meetings of the Federal Reserve and the Bank of England will be held next week, so nothing should prevent the pound from falling in the last two days of the week. On the 5-minute chart, it is recommended to trade at the levels 1.1793, 1.1863-1.1877, 1.1924, 1.1992-1.2008, 1.2065-1.2079, 1.2143, 1.2171-1.2179, 1.2245-1.2260, 1.2337-1.2343 and 1.2387. As soon as the price passes 20 pips in the right direction, you should set a Stop Loss to breakeven. On Thursday, no interesting report is scheduled in the UK, while in the US, only a few minor reports will be released. Nevertheless, we do not expect the pound to stay in one place all day. The general fundamental background is too strong for it now.
Trading tips on Thursday:
1) The strength of the signal is determined by the time it took the signal to form (a rebound or a breakout of the level). The quicker it is formed, the stronger the signal is.
2) If two or more positions were opened near a certain level based on a false signal (which did not trigger a Take Profit or test the nearest target level), then all subsequent signals at this level should be ignored.
3) When trading flat, a pair can form multiple false signals or not form them at all. In any case, it is better to stop trading at the first sign of a flat movement.
4) Trades should be opened in the period between the start of the European session and the middle of the US trading hours when all positions must be closed manually.
5) You can trade using signals from the MACD indicator on the 30-minute time frame only amid strong volatility and a clear trend that should be confirmed by a trendline or a trend channel.
6) If two levels are located too close to each other (from 5 to 15 pips), they should be considered support and resistance levels.
On the chart:
Support and Resistance levels are the levels that serve as targets when buying or selling the pair. You can place Take Profit near these levels.
Red lines are channels or trend lines that display the current trend and show in which direction it is better to trade now.
The MACD indicator (14, 22, and 3) consists of a histogram and a signal line. When they cross, this is a signal to enter the market. It is recommended to use this indicator in combination with trend patterns (channels and trendlines).
Important announcements and economic reports that can be found on the economic calendar can seriously influence the trajectory of a currency pair. Therefore, at the time of their release, we recommend trading as carefully as possible or exiting the market in order to avoid sharp price fluctuations.
Beginners on Forex should remember that not every single trade has to be profitable. The development of a clear strategy and money management is the key to success in trading over a long period of time.