empty
08.02.2023 08:17 PM
Technical analysis of EUR/USD for February 08, 2023

This image is no longer relevant

Overview:

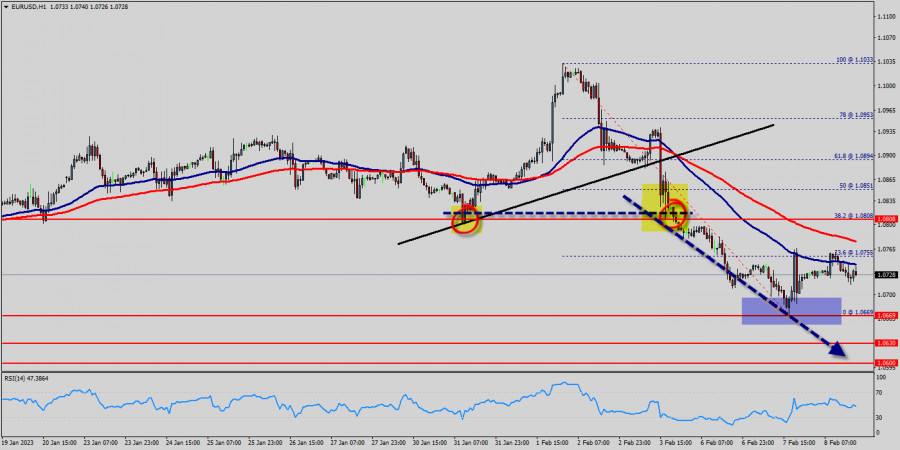
The EUR/USD pair has faced strong resistances at the levels of 1.0880 because support had become resistance last week. So, the strong resistance has been already formed at the level of 1.0880 and the pair is likely to try to approach it in order to test it again. However, if the pair fails to pass through the level of 1.0880, the market will indicate a bearish opportunity below the new strong resistance level of 1.0880 (the level of 1.0880 coincides with a ratio of 38.2% Fibonacci - last bullish wave - double top).

Moreover, the RSI starts signaling a downward trend, as the trend is still showing strength above the moving average (100) and (50). The trend of EUR/USD pair movement was controversial as it took place in the downtrend channel.

Due to the previous events, the price is still set between the levels of 1.0808 and 1.0669, so it is recommended to be careful while making deals in these levels because the prices of 1.0808 and 1.0669 are representing the resistance and support respectively.

Therefore, it is necessary to wait till the downtrend channel is passed through. Then the market will probably show the signs of a bearish market.

It should be noted that the volatility is very high for that the price of the EUR/USD pair is still trading between the prices of 1.0669 and 1.0808 in the coming hours.

Furthermore, the price has been set below the strong resistance at the levels of 1.0808 and 1.0851 which coincide with the 38.2% and 50% Fibonacci retracement levels respectively.

Thus, the market is indicating a bearish opportunity below 1.0808 so it will be good to sell at 1.0808 with the first target of 1.0669.

It will also call for a downtrend in order to continue towards 1.0630. The daily strong support is seen at 1.0600.

However, the stop loss should always be taken into account, for that it will be reasonable to set your stop loss at the level of 1.0851.

Moving averages, in the meantime, maintain their bearish slope way above the current level. Furthermore, although the news is bearish for the EUR/USD pair, professional may not want to sell weakness, but rather following a rebound rally.

Additionally, some aggressive counter-trend buyers may be defending parity. In case a continuousion takes place and the EUR/USD pair breaks through the support level of 1.0669 , a further decline to 1.0600 can occur which would indicate a bearish market.

Signal :

It should be noted that the 1.0808 price will act as a major resistance on Feb. 08th, 2023. Therefore, it will be too gainful to sell short below 1.0808 and look for further downside with 1.0669, 1.0630 and 1.0600 targets. It should also be reminded that stop loss must never exceed the maximum exposure amounts. Thus, stop loss should be placed at the 1.0851 level today.

Pilih timeframe
5
mnt
15
mnt
30
mnt
1
jam
4
jam
1
hari
1
minggu
Dapatkan keuntungan dari perubahan nilai mata uang kripto dengan InstaForex.
Unduh MetaTrader 4 dan buka perdagangan pertama Anda.
  • Grand Choice
    Contest by
    InstaForex
    InstaForex always strives to help you
    fulfill your biggest dreams.
    GABUNG KONTES

Artikel yang direkomendasikan

GBP/USD – 28 Mei: Bagaimana Notulen FOMC Akan Memengaruhi Pasar?

Pada grafik per jam, pasangan GBP/USD melanjutkan penurunannya pada hari Selasa dan berkonsolidasi di bawah level retracement Fibonacci 161,8% di 1,3520. Ini berarti bahwa tren menurun dapat berlanjut hari

Samir Klishi 09:54 2025-05-28 UTC+2

Prediki EUR/USD untuk 28 Mei 2025

Pada hari Selasa, euro mengalami koreksi teknikal dari level resistance 1,1420. Pada hari yang sama, emas turun sebesar 1,14%, minyak mentah WTI turun 0,44%, dan imbal hasil obligasi pemerintah sedikit

Laurie Bailey 05:08 2025-05-28 UTC+2

Prediksi GBP/USD untuk 28 Mei 2025

Pada hari Selasa, pound Inggris ragu-ragu untuk memasuki celah sempit antara garis saluran harga dan level target 1.3635. Dalam konteks penguatan indeks dolar AS sebesar 0,42%, upaya semacam itu kemungkinan

Laurie Bailey 05:08 2025-05-28 UTC+2

Prediksi USD/JPY untuk 28 Mei 2025

Kemarin, pasangan USD/JPY mencatat pertumbuhan yang solid—0,90% atau 149 pip—berkat penguatan indeks dolar AS sebesar 0,42%. Akibatnya, harga sekarang diperdagangkan di atas keseimbangan harian, garis indikator MACD, dan bahkan Marlin

Laurie Bailey 05:08 2025-05-28 UTC+2

Analisis Teknikal Pergerakan Harga Intraday Pasangan Mata Uang Silang AUD/JPY, Rabu 28 Mei 2025.

Dengan munculnya Konvergensi antara pergerakan pasangan mata uang AUD/JPY terhadap indikator Stochastic Oscillator serta dikonfirmasi juga oleh pergerakan harganya yang bergerak diatas WMA (21) yang memiliki kemiringan slope yang menukik

Arief Makmur 04:53 2025-05-28 UTC+2

EUR/JPY. Situasi Pasar Saat Ini dan Prakiraan

Hari ini, pasangan EUR/JPY menarik pembeli setelah mengalami penurunan selama sesi Asia ke level kunci 162.00. Dari sudut pandang teknis, osilator pada grafik per jam dan harian telah berubah positif

Irina Yanina 19:28 2025-05-27 UTC+2

Sinyal Trading untuk EMAS (XAU/USD) pada 27-29 Mei 2025: beli di atas $3.281 (Murray 6/8 - SMA 21)

Di sisi lain, jika emas mempertahankan momentum bullish, harga dapat menembus ke atas sistance pada 3.330, dan kemudian kami dapat mengantisipasi urutan bullish baru, yang berpotensi mencapai 3.437, level Murray

Dimitrios Zappas 18:33 2025-05-27 UTC+2

Sinyal Trading untuk EUR/USD pada 27-29 Mei: jual di bawah 1.1350 (21 SMA - 7/8 Murray)

Di awal sesi Amerika, pasangan EUR/USD trading di sekitar 1.3056 dalam saluran tren naik, menunjukkan tanda-tanda kelelahan. Euro mencoba untuk menembus resistensi mingguan di 1.1418 selama sesi Eropa, namun tidak

Dimitrios Zappas 18:31 2025-05-27 UTC+2

Prediksi untuk EUR/USD pada 27 Mei 2025

Pada hari Senin, pasangan EUR/USD kembali ke zona support 1.1374–1.1380. Pemantulan dari zona ini akan kembali menguntungkan euro dan melanjutkan pertumbuhan menuju level retracement 76.4% di 1.1454. Para bull belum

Samir Klishi 11:47 2025-05-27 UTC+2

Prediksi untuk GBP/USD pada 27 Mei 2025

Pada grafik per jam, pasangan GBP/USD terus naik pada hari Senin dari level retracement Fibonacci 161,8% di 1,3520. Namun, pada siang hari, muncul berita bahwa eskalasi baru pada perang dagang

Samir Klishi 11:44 2025-05-27 UTC+2
Tidak bisa bicara sekarang?
Tanyakan pertanyaan anda lewat chat.
Widget callback
 

Dear visitor,

Your IP address shows that you are currently located in the USA. If you are a resident of the United States, you are prohibited from using the services of InstaFintech Group including online trading, online transfers, deposit/withdrawal of funds, etc.

If you think you are seeing this message by mistake and your location is not the US, kindly proceed to the website. Otherwise, you must leave the website in order to comply with government restrictions.

Why does your IP address show your location as the USA?

  • - you are using a VPN provided by a hosting company based in the United States;
  • - your IP does not have proper WHOIS records;
  • - an error occurred in the WHOIS geolocation database.

Please confirm whether you are a US resident or not by clicking the relevant button below. If you choose the wrong option, being a US resident, you will not be able to open an account with InstaForex anyway.

We are sorry for any inconvenience caused by this message.