empty
08.02.2023 08:17 PM
Technical analysis of EUR/USD for February 08, 2023

This image is no longer relevant

Overview:

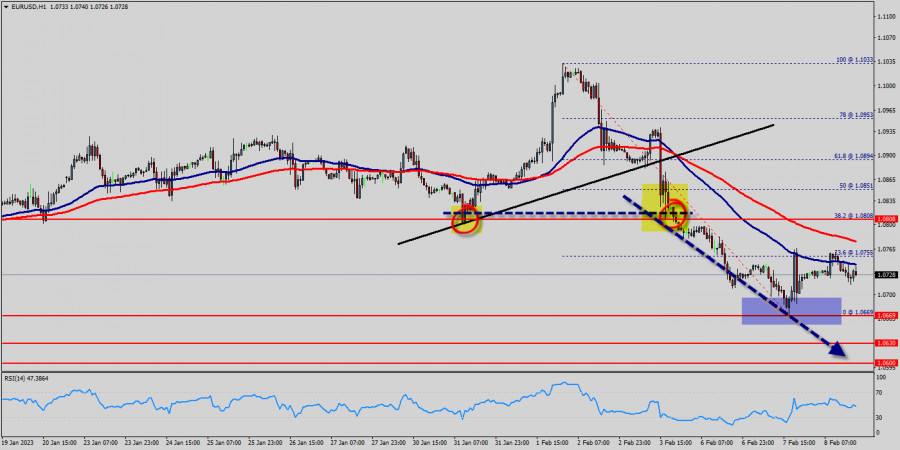
The EUR/USD pair has faced strong resistances at the levels of 1.0880 because support had become resistance last week. So, the strong resistance has been already formed at the level of 1.0880 and the pair is likely to try to approach it in order to test it again. However, if the pair fails to pass through the level of 1.0880, the market will indicate a bearish opportunity below the new strong resistance level of 1.0880 (the level of 1.0880 coincides with a ratio of 38.2% Fibonacci - last bullish wave - double top).

Moreover, the RSI starts signaling a downward trend, as the trend is still showing strength above the moving average (100) and (50). The trend of EUR/USD pair movement was controversial as it took place in the downtrend channel.

Due to the previous events, the price is still set between the levels of 1.0808 and 1.0669, so it is recommended to be careful while making deals in these levels because the prices of 1.0808 and 1.0669 are representing the resistance and support respectively.

Therefore, it is necessary to wait till the downtrend channel is passed through. Then the market will probably show the signs of a bearish market.

It should be noted that the volatility is very high for that the price of the EUR/USD pair is still trading between the prices of 1.0669 and 1.0808 in the coming hours.

Furthermore, the price has been set below the strong resistance at the levels of 1.0808 and 1.0851 which coincide with the 38.2% and 50% Fibonacci retracement levels respectively.

Thus, the market is indicating a bearish opportunity below 1.0808 so it will be good to sell at 1.0808 with the first target of 1.0669.

It will also call for a downtrend in order to continue towards 1.0630. The daily strong support is seen at 1.0600.

However, the stop loss should always be taken into account, for that it will be reasonable to set your stop loss at the level of 1.0851.

Moving averages, in the meantime, maintain their bearish slope way above the current level. Furthermore, although the news is bearish for the EUR/USD pair, professional may not want to sell weakness, but rather following a rebound rally.

Additionally, some aggressive counter-trend buyers may be defending parity. In case a continuousion takes place and the EUR/USD pair breaks through the support level of 1.0669 , a further decline to 1.0600 can occur which would indicate a bearish market.

Signal :

It should be noted that the 1.0808 price will act as a major resistance on Feb. 08th, 2023. Therefore, it will be too gainful to sell short below 1.0808 and look for further downside with 1.0669, 1.0630 and 1.0600 targets. It should also be reminded that stop loss must never exceed the maximum exposure amounts. Thus, stop loss should be placed at the 1.0851 level today.

Summary
Urgency
Analytic
Mourad El Keddani
Start trade
รับผลกำไรจากการเปลี่ยนแปลงอัตราสกุลเงินดิจิทัลกับ InstaForex.
ดาวน์โหลด MetaTrader 4 และเปิดการซื้อขายครั้งแรกของคุณ.
การคาดการณ์ EUR/USD สำหรับวันที่ 19 กันยายน พ.ศ. 2568 ค่าเงินยูโรได้ค่อย ๆ ถอยหลังออกจากระดับสูงสุดเมื่อวันที่ 17 กันยายน โดยทั่วไปแล้ว หลังจากการประชุมของธนาคารกลางสิ้นสุดลงและไม่มีแนวโน้มใหม่เกิดขึ้น นักลงทุนจะเปลี่ยนความสนใจไปยังความสมดุลของตัวชี้วัดทางเศรษฐกิจ ซึ่งเป็นตัวชี้นำของนโยบายการเงิน บางครั้งอาจดูเหมือนว่ายอดขายสินค้าปลีกหรือการอนุญาตก่อสร้างไม่สามารถเคลื่อนอัตราแลกเปลี่ยนให้ขึ้นหรือลง 1% ได้ แต่ประกาศเหล่านี้มีพลังในการเคลื่อนทิศทางระยะยาวที่สามารถสนับสนุนแนวโน้มไปได้หลายเดือนข้างหน้า การไม่มีการตอบสนองในตลาดทันทีต่อการเปลี่ยนอัตราดอกเบี้ยของ
  • Grand Choice
    Contest by
    InstaForex
    InstaForex always strives to help you
    fulfill your biggest dreams.
    เข้าร่วมการแข่งขัน


บทความแนะนำ

การคาดการณ์ EUR/USD สำหรับวันที่ 19 กันยายน พ.ศ. 2568

ค่าเงินยูโรได้ค่อย ๆ ถอยหลังออกจากระดับสูงสุดเมื่อวันที่ 17 กันยายน โดยทั่วไปแล้ว หลังจากการประชุมของธนาคารกลางสิ้นสุดลงและไม่มีแนวโน้มใหม่เกิดขึ้น นักลงทุนจะเปลี่ยนความสนใจไปยังความสมดุลของตัวชี้วัดทางเศรษฐกิจ ซึ่งเป็นตัวชี้นำของนโยบายการเงิน บางครั้งอาจดูเหมือนว่ายอดขายสินค้าปลีกหรือการอนุญาตก่อสร้างไม่สามารถเคลื่อนอัตราแลกเปลี่ยนให้ขึ้นหรือลง 1% ได้ แต่ประกาศเหล่านี้มีพลังในการเคลื่อนทิศทางระยะยาวที่สามารถสนับสนุนแนวโน้มไปได้หลายเดือนข้างหน้า การไม่มีการตอบสนองในตลาดทันทีต่อการเปลี่ยนอัตราดอกเบี้ยของ

Laurie Bailey 04:57 2025-09-19 UTC+2

การคาดการณ์ GBP/USD สำหรับวันที่ 19 กันยายน 2025

ธนาคารแห่งประเทศอังกฤษได้จัดการประชุมเมื่อวานนี้ ซึ่งตรงตามความคาดหมายเกือบทั้งหมด ยกเว้นในส่วนของการลงคะแนน: โดยคาดการณ์ไว้ว่าจะมีเสียง 8-1 ในการคงอัตราดอกเบี้ย แต่ผลออกมากลายเป็น 7-2 ขณะนี้ความคาดหวังในการปรับลดอัตราดอกเบี้ยได้เปลี่ยนไปเป็นเดือนพฤศจิกายน ในขณะเดียวกัน ความตระหนักก็แพร่กระจายไปทั่วสื่อและตลาดว่า Fed คงไม่ลดอัตราดอกเบี้ยสองครั้งก่อนสิ้นปี ดังนั้น

Laurie Bailey 04:57 2025-09-19 UTC+2

การคาดการณ์ USD/JPY สำหรับวันที่ 19 กันยายน 2025

คู่สกุลเงิน USD/JPY ใช้เวลาตลอดสัปดาห์ที่ผ่านมาในเกมที่ซับซ้อนและสับสน โดยมีการเคลื่อนไหวที่ผิดพลาดในทั้งสองทิศทาง ล่าสุดเกิดการทะลุหลอกที่ลึกลงใต้ระดับแนวรับที่ 146.29 ด้วยเงาล่างในวันพุธ ตอนนี้ ราคาจะพยายามทำลายและยืนเหนือเส้น MACD ระดับรายวัน (148.28) ถ้าสำเร็จ ราคาจะสามารถขึ้นไปเหนือระดับเป้าหมายแรกที่ 149.38

Laurie Bailey 04:57 2025-09-19 UTC+2

XAU/USD: การวิเคราะห์และการพยากรณ์

ราคาทองคำลดลงเป็นวันที่สองติดต่อกันจากระดับสูงสุดเป็นประวัติการณ์ หลังจากความผันผวนที่เกิดขึ้นจากการดำเนินการของ Fed เป็นวันที่สองติดต่อกันที่ราคาทองคำลดลงจากระดับสูงสุดเป็นประวัติการณ์ หลังจากความผันผวนที่เกิดขึ้นโดยการเคลื่อนไหวของ Fed ทองคำได้ลดลงต่ำกว่า $3658 และเส้นค่าเฉลี่ยเคลื่อนที่แบบง่าย (SMA) ระยะเวลา 50 รอบบนกราฟ 4 ชั่วโมง

Irina Yanina 20:12 2025-09-18 UTC+2

การคาดการณ์สำหรับ EUR/USD ในวันที่ 18 กันยายน 2025

เมื่อวันพุธ คู่เงิน EUR/USD เด้งกลับจากระดับการปรับตัว 127.2% ที่ 1.1896 ปรับตัวในทิศทางที่ดีสำหรับดอลลาร์สหรัฐ และร่วงลงเข้าสู่พื้นที่แนวรับที่ 1.1789–1.1802 ขณะนี้สามารถกล่าวได้ว่าผู้ค้าได้ประเมินการประชุม Fed และคำพูดของ Powell อย่างเต็มที่แล้ว

Samir Klishi 12:21 2025-09-18 UTC+2

การพยากรณ์สำหรับ GBP/USD ในวันที่ 18 กันยายน 2025

ในกราฟรายชั่วโมง คู่สกุลเงิน GBP/USD เมื่อวันพุธที่ผ่านมาได้เคลื่อนตัวขึ้นถึงระดับ 127.2% ของ Fibonacci ที่ 1.3708 และได้ตีกลับจากจุดนั้น และปรับทิศทางกลับไปในทางตรงข้ามกับเงินดอลลาร์สหรัฐ ทำให้ตกเข้าสู่โซนแนวรับที่ 1.3587–1.3620 วันนี้การรวมตลาดต่ำกว่าโซนนี้จะยอมให้มีการลดลงต่อไปยังระดับการปรับฐาน 76.4%

Samir Klishi 12:17 2025-09-18 UTC+2

GBP/USD. การวิเคราะห์อินดิเคเตอร์ประจำวันที่ 18 กันยายน 2025

การวิเคราะห์แนวโน้ม (รูปที่ 1) ในวันพฤหัสบดี จากระดับ 1.3622 (ระดับปิดของกราฟแท่งเทียนรายวันของเมื่อวาน) ตลาดอาจเคลื่อนตัวลงต่อไปสู่เป้าหมายที่ 1.3548 – แฟรกทัลด้านบน (เส้นประสีแดง) จากระดับนี้ ราคาอาจดีดตัวกลับขึ้นไปสู่ระดับ 1.3583

Stefan Doll 11:59 2025-09-18 UTC+2

EUR/USD. การวิเคราะห์ด้วยตัวชี้วัดในวันที่ 18 กันยายน 2025

การวิเคราะห์แนวโน้ม (รูปที่ 1) ในวันพฤหัสบดี ตลาดอาจเคลื่อนตัวลงต่อเนื่องจากระดับ 1.1812 (ราคาปิดของแท่งเทียนรายวันเมื่อวานนี้) มุ่งหน้าไปที่เป้าหมาย 1.1762 ซึ่งเป็นระดับการดึงกลับ 85.4% (เส้นประสีแดง) หลังจากทดสอบระดับนี้แล้ว ราคาอาจดีดตัวขึ้นไปที่ 1.1779

Stefan Doll 11:38 2025-09-18 UTC+2

การทำนายอัตราแลกเปลี่ยน 18/09/2025: EUR/USD, GBP/USD, USD/JPY, USDX และ Bitcoin

ลิงก์ที่มีประโยชน์: บทความอื่นๆ ของฉันสามารถหาอ่านได้ที่ส่วนนี้ คอร์ส InstaForex สำหรับผู้เริ่มต้น วิทยาการวิเคราะห์ยอดนิยม เปิดบัญชีซื้อขาย สำคัญ: มือใหม่ในตลาดฟอเร็กซ์ต้องระมัดระวังมากเมื่อทำการตัดสินใจเกี่ยวกับการเข้าไปในตลาด ก่อนการประกาศรายงานที่สำคัญ ควรหลีกเลี่ยงการอยู่ในตลาดเพื่อป้องกันการถูกผลกระทบจากความผันผวนที่เพิ่มขึ้น หากคุณตัดสินใจที่จะซื้อขายในช่วงการประกาศข่าว ควรวางคำสั่งหยุดขาดทุน (stop

Sebastian Seliga 10:14 2025-09-18 UTC+2

คู่เงิน XPD/USD อาจมีแนวโน้มอ่อนค่าลงในวันนี้ เนื่องจากปรากฏการณ์ Hidden Bearish Divergence วันพฤหัสบดีที่ 18 กันยายน 2025

[XPD/USD] – [วันพฤหัสบดีที่ 18 กันยายน 2025] การปรากฏของ Hidden Bearish Divergence ร่วมกับการตัดกันของเส้น EMA ทั้งสองด้วยรูปแบบ Death Cross

Arief Makmur 07:28 2025-09-18 UTC+2
หากไม่สะดวกคุยในตอนนี้
ระบุคำถามไว้ได้ใน แชท.
Widget callback
 

Dear visitor,

Your IP address shows that you are currently located in the USA. If you are a resident of the United States, you are prohibited from using the services of InstaFintech Group including online trading, online transfers, deposit/withdrawal of funds, etc.

If you think you are seeing this message by mistake and your location is not the US, kindly proceed to the website. Otherwise, you must leave the website in order to comply with government restrictions.

Why does your IP address show your location as the USA?

  • - you are using a VPN provided by a hosting company based in the United States;
  • - your IP does not have proper WHOIS records;
  • - an error occurred in the WHOIS geolocation database.

Please confirm whether you are a US resident or not by clicking the relevant button below. If you choose the wrong option, being a US resident, you will not be able to open an account with InstaForex anyway.

We are sorry for any inconvenience caused by this message.