empty
01.02.2023 08:19 AM
Outlook and trading signals for GBP/USD on February 1. COT report. Analysis of market situation. It's getting interesting, but the pound is still flat.

M5 chart of GBP/USD

This image is no longer relevant

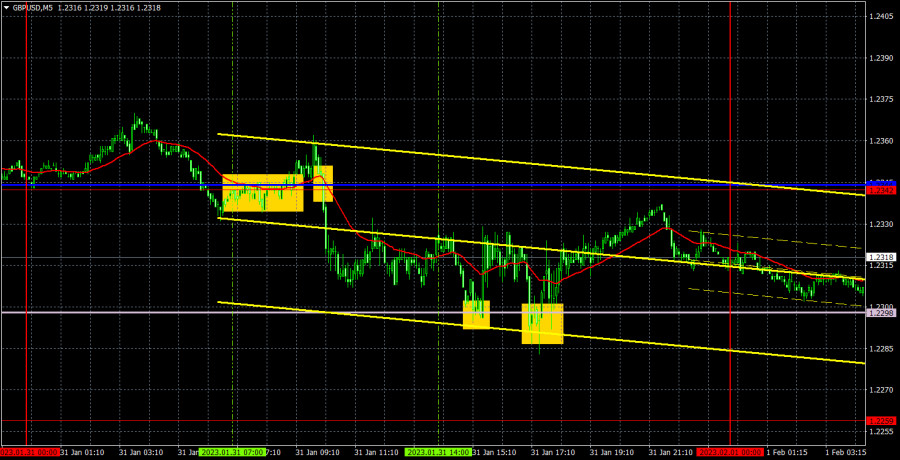
GBP/USD continues to move within the sideways channel, which is not surprising, since the pound was mostly flat for about three weeks. We will finally receive important reports starting today, so we can hope for a trendy, volatile movement. At the moment, the pair reached the lower limit of the channel, so according to the technique, it may bounce from it and start a new round of upward movement. If today's reports are not in favor of the USD, the pound may surge, which will occur within the same sideways channel. Yesterday, the pair could not cross the Senkou Span B line twice, so there are not many technical reasons to expect the continuation of the decline.

Yesterday, there were four trade signals. The pair initially settled above the critical line, and frankly, this signal was false. The price could not even pass 20 points in the right direction. Then it settled below the Kijun-Sen line, afterwards the pair descended to the Senkou Span B. You could earn about 25 pips on this deal, which covered the loss from the first trade. Two rebounds from the Senkou Span B could be worked out using long positions. In the first case, the deal was closed with Stop Loss at breakeven, in the second case, traders could earn about 15-20 points of profit, and the deal should have been closed manually closer to the evening. Not a bad result, given the flat.

COT report
This image is no longer relevant

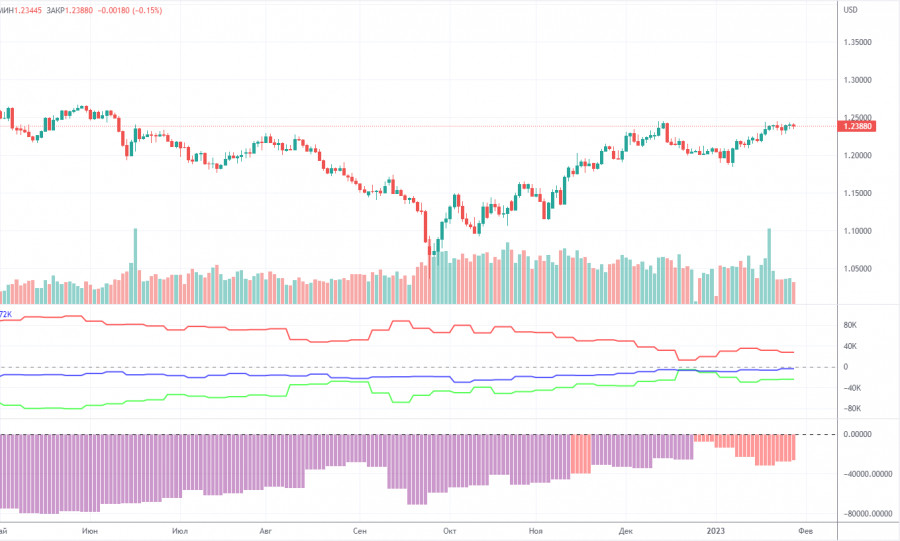
The latest COT report showed a decrease in bearish sentiment. In a week, non-commercial traders closed 6,700 long positions and 7,500 short positions. The net non-commercial position grew by 800. The net non-commercial position has been on the rise in recent months. The sentiment of large traders may soon turn bullish. Although the pound sterling has been bullish against the greenback in recent months, its growth can hardly be explained with the help of fundamental analysis. We should not rule out the possibility that the pound may fall against the dollar in the medium term as a correction is needed. Overall, the latest COT reports have been in line with the pair's movement. Since the net position is not bullish yet, the buying spree may go on for several months more. Non-commercial traders now hold 35,000 long positions and 59,000 short ones. We are still skeptical about the pair being bullish in the long term although there are technical reasons for that. However, in terms of fundamentals and geopolitics, this will unlikely be a strong and fast uptrend.

H1 chart of GBP/USD
This image is no longer relevant

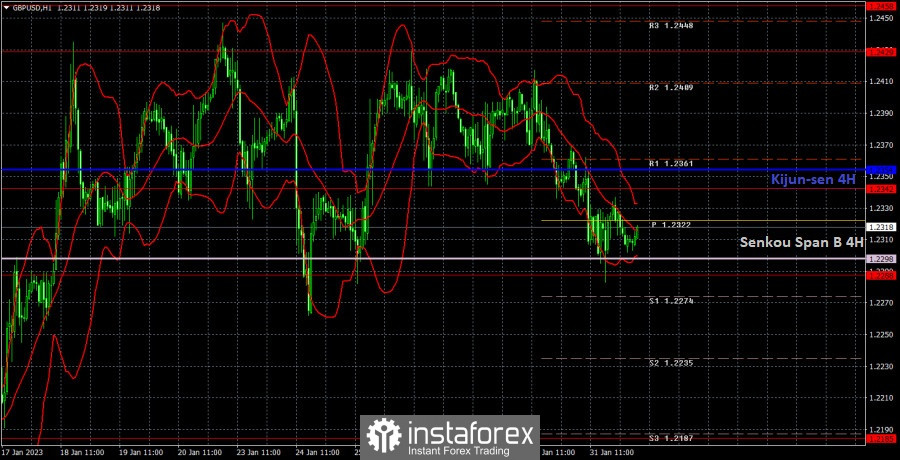
On the one-hour chart, GBP/USD is still moving in the sideways channel. You can clearly see this on the charts. Lines of the indicator Ichimoku are not strong now, but we still fixed their last position in order not to form a ton of false signals near them. Now we will wait for the pair to cross both the Ichimoku indicator lines. Otherwise, a new round of growth inside the sideways channel with 1.2429 as the target. On February 1, the pair may trade at the following levels: 1.1974-1.2007, 1.2106, 1.2185, 1.2288, 1.2342, 1.2429-1.2458, 1.2589, 1.2659. The Senkou Span B (1.2298) and Kijun Sen (1.2354) lines may also generate signals. Pullbacks and breakouts through these lines may produce signals as well. A Stop Loss order should be set at the breakeven point after the price passes 20 pips in the right direction. Ichimoku indicator lines may move during the day, which should be taken into account when determining trading signals. In addition, the chart does illustrate support and resistance levels, which could be used to lock in profits. On Wednesday, the UK will only release its manufacturing PMI report, on the other hand, the US will release an important report on the ISM manufacturing index. In the evening, the results of the Federal Reserve meeting will be announced and Fed Chairman Jerome Powell's succeeding press conference.

What we see on the trading charts:

Price levels of support and resistance are thick red lines, near which the movement may end. They do not provide trading signals.

The Kijun-sen and Senkou Span B lines are the lines of the Ichimoku indicator, moved to the one-hour chart from the 4-hour one. They are strong lines.

Extreme levels are thin red lines from which the price bounced earlier. They provide trading signals.

Yellow lines are trend lines, trend channels, and any other technical patterns.

Indicator 1 on the COT charts reflects the net position size of each category of traders.

Indicator 2 on the COT charts reflects the net position size for the non-commercial group.

Paolo Greco,
ผู้เชี่ยวชาญด้านการวิเคราะห์ของ InstaForex
© 2007-2025
เลือกช่วงเวลา
5
นาที
15
นาที
30
นาที
1
ชั่วโมง
4
ชั่วโมง
1
วัน
1
สัปดาห์
รับผลกำไรจากการเปลี่ยนแปลงอัตราสกุลเงินดิจิทัลกับ InstaForex.
ดาวน์โหลด MetaTrader 4 และเปิดการซื้อขายครั้งแรกของคุณ.
  • Grand Choice
    Contest by
    InstaForex
    InstaForex always strives to help you
    fulfill your biggest dreams.
    เข้าร่วมการแข่งขัน


บทความแนะนำ

GBP/USD: แผนการซื้อขายสำหรับรอบการซื้อขายในสหรัฐอเมริกา วันที่ 17 มิถุนายน (รีวิวการซื้อขายช่วงเช้า)

ในการพยากรณ์ช่วงเช้าของฉัน ฉันได้เน้นที่ระดับ 1.3559 และวางแผนที่จะตัดสินใจซื้อขายบนพื้นฐานนี้ มาดูกราฟ 5 นาทีและดูว่าเกิดอะไรขึ้น การลดลงและการเกิด false breakout ที่ระดับนั้นนำไปสู่โอกาสในการซื้อเงินปอนด์ แต่การเคลื่อนไหวขึ้นนั้นไม่ได้พัฒนาเป็นสิ่งสำคัญอะไร ภาพรวมทางเทคนิคได้ถูกปรับใหม่สำหรับครึ่งหลังของวัน เปิดสถานะซื้อ GBP/USD

Miroslaw Bawulski 20:57 2025-06-17 UTC+2

EUR/USD: แผนการซื้อขายสำหรับช่วงสหรัฐอเมริกาในวันที่ 17 มิถุนายน (รีวิวการซื้อขายในช่วงเช้า)

ในคำพยากรณ์เมื่อเช้าของฉัน ฉันได้เน้นถึงระดับ 1.1566 และวางแผนที่จะตัดสินใจเข้าสู่ตลาดตามระดับนี้ ลองดูกราฟ 5 นาทีเพื่อเข้าใจว่าเกิดอะไรขึ้น การขึ้นและการเกิดการเบรคเอาท์ปลอมที่ระดับนั้นเสนอจุดเข้าที่ดีสำหรับการขายยูโร แต่ก็ไม่ได้มีการเคลื่อนที่ลงมาก หลังจากการลดลง 20 จุด ความต้องการยูโรก็กลับมา ทัศนะแนวโน้มทางเทคนิคสำหรับช่วงครึ่งหลังของวันจึงถูกปรับใหม่ การเปิดสถานะซื้อ

Miroslaw Bawulski 20:49 2025-06-17 UTC+2

วิธีการเทรดคู่เงิน GBP/USD ในวันที่ 17 มิถุนายน? เคล็ดลับง่ายๆ และการวิเคราะห์การซื้อขายสำหรับผู้เริ่มต้น

ในวันจันทร์ คู่เงิน GBP/USD ยังคงเคลื่อนไหวขึ้นอย่างต่อเนื่อง การทะลุเส้นแนวโน้มขาขึ้นที่เกิดอีกครั้งไม่นำไปสู่การเพิ่มค่าของเงินดอลลาร์สหรัฐ ซึ่งยังคงลดลงอย่างสม่ำเสมอและอ่อนค่าในระยะกลาง ในกรอบเวลารายชั่วโมง ขณะนี้มีเส้นแนวโน้มขาขึ้นใหม่ ราคาของคู่เงินนี้ได้มีการกระเด้งออกจากเส้นแนวโน้มนี้ถึงสามครั้งแล้ว และอาจจะกระเด้งครั้งที่สี่ได้ในวันนี้ ซึ่งอาจก่อให้เกิดการเคลื่อนไหวขาขึ้นใหม่ของเงินปอนด์อังกฤษ การลงไปต่ำกว่าเส้นแนวโน้มนี้จะไม่ได้มีน้ำหนักอะไรมากนักสำหรับเงินดอลลาร์ เพราะไม่ว่ารูปแบบทางเทคนิคใด ๆ ที่เกิดขึ้น

Paolo Greco 06:38 2025-06-17 UTC+2

การซื้อขายคู่สกุลเงิน EUR/USD ในวันที่ 17 มิถุนายน? เคล็ดลับง่ายๆ และการวิเคราะห์การซื้อขายสำหรับผู้เริ่มต้น

ในวันจันทร์ คู่สกุลเงิน EUR/USD ยังคงเคลื่อนไหวในทิศทางขาขึ้น ซึ่งเริ่มตั้งแต่ครึ่งหลังของวันศุกร์ อย่างไรก็ตาม ฝ่ายที่มองว่าราคาจะปรับเพิ่มขึ้นไม่สามารถเบรกผ่านระดับ 1.1609 เป็นครั้งที่สามได้ มันชัดเจนว่าค่าเงินยูโรได้ถึงจุดจำกัดเมื่อเทียบกับการอ่อนค่าของดอลลาร์สหรัฐแล้ว สำหรับการปรับตัวขึ้นที่จะดำเนินต่อไป ต้องการข้อมูลเชิงลบใหม่จากอีกฝั่งของแอตแลนติก และตรงไปตรงมา เราไม่สงสัยว่ามันจะมาถึงในไม่ช้า ด้วยการประชุมของ

Paolo Greco 06:38 2025-06-17 UTC+2

คำแนะนำและการวิเคราะห์การซื้อขายสำหรับ GBP/USD เมื่อวันที่ 17 มิถุนายน: ปอนด์ไม่ปล่อยให้โอกาสหลุดมือ

ในวันจันทร์ที่ผ่านมา คู่สกุลเงิน GBP/USD เคลื่อนไหวขึ้นตามที่คาดไว้ ในช่วงสัปดาห์ที่ผ่านมา การเคลื่อนไหวของคู่นี้ออกจะไปทางเส้นข้างมากกว่าจะเป็นกระแสขาขึ้น อย่างไรก็ตาม มันแทบไม่ได้ลดลงและยังคงอัปเดตระดับสูงสุดในรอบท้องถิ่นและสามปีอย่างต่อเนื่อง ดังนั้น สภาวะตลาดและรูปแบบการเคลื่อนไหวยังคงไม่เปลี่ยนแปลงอย่างมีนัยสำคัญ ในวันจันทร์ ดอลลาร์ประสบกับการลดลงอีกครั้งเนื่องจากความตึงเครียดในตะวันออกกลาง ในอดีต ดอลลาร์ได้รับการสนับสนุนจากความมั่นใจอย่างแรงในตลาด เพราะมันมักถูกมองว่าเป็น

Paolo Greco 03:49 2025-06-17 UTC+2

คำแนะนำและการวิเคราะห์การซื้อขายสำหรับ EUR/USD ในวันที่ 17 มิถุนายน: ปัจจัยด้านภูมิรัฐศาสตร์มีบทบาท

คู่สกุลเงิน EUR/USD แสดงแรงเคลื่อนไหวขึ้นอย่างแข็งแกร่งในวันอังคาร ตามที่เราคาดการณ์ไว้ ไม่มีรายงานเศรษฐกิจมหภาค—หลักหรือย่อย—ที่ถูกเผยแพร่ในวันดังกล่าว ดังนั้นการลดลงล่าสุดของดอลลาร์สหรัฐฯ สามารถอธิบายได้ด้วยเหตุการณ์ที่เกิดขึ้นในช่วงสุดสัปดาห์เป็นหลัก ย้อนถึงเหตุการณ์ในวันศุกร์ที่อิสราเอลเปิดการโจมตีด้วยขีปนาวุธต่ออิหร่าน ซึ่งทำลายหรือสร้างความเสียหายอย่างหนักต่อสิ่งอำนวยความสะดวกทางทหารและนิวเคลียร์ ตลาดได้ตอบสนองต่อเหตุการณ์นี้ในวันศุกร์ แต่ในวันเสาร์ อิหร่านได้ตอบโต้ด้วยการโจมตีด้วยขีปนาวุธ และในวันจันทร์ การยิงจากทั้งสองฝ่ายยังคงเกิดขึ้น ตลาดต้องใช้เวลาในการรับมือกับการปะทุของสงครามที่เพิ่มขึ้นนี้ในวันจันทร์

Paolo Greco 03:49 2025-06-17 UTC+2

GBP/USD: แผนการซื้อขายสำหรับช่วงการซื้อขายในสหรัฐฯ วันที่ 16 มิถุนายน (การวิเคราะห์การซื้อขายในช่วงเช้า)

ในคำทำนายตอนเช้าของฉัน ฉันเน้นที่ระดับ 1.3568 และวางแผนการตัดสินใจเข้าตลาดโดยอิงจากระดับนี้ ลองดูที่กราฟ 5 นาทีและดูว่าเกิดอะไรขึ้น มีการเคลื่อนไหวขึ้นและการทดสอบลวงที่เกิดขึ้นที่ระดับนั้น นำไปสู่การเปิดคำสั่งขายสำหรับเงินปอนด์ แต่ไม่มีการเคลื่อนไหวลงที่มีนัยสำคัญ ภาพทางเทคนิคถูกแก้ไขอีกครั้งสำหรับครึ่งหลังของวัน การเปิดสถานะ Long บน GBP/USD

Miroslaw Bawulski 19:18 2025-06-16 UTC+2

EUR/USD: แผนการซื้อขายสำหรับช่วงเซสชั่นของสหรัฐอเมริกาในวันที่ 16 มิถุนายน (วิเคราะห์การซื้อขายในช่วงเช้า)

ในการพยากรณ์ช่วงเช้าของฉัน ฉันได้เน้นที่ระดับ 1.1566 และวางแผนที่จะตัดสินใจซื้อขายตามระดับนี้ ลองมาดูกราฟ 5 นาทีและวิเคราะห์สิ่งที่เกิดขึ้น กัน มีการเคลื่อนไหวขึ้นและเกิดการทะลุ แต่ไม่มีการทดสอบซ้ำ ทำให้ฉันไม่ได้ทำการซื้อขาย ทางเทคนิคของภาพได้ถูกปรับแก้สำหรับช่วงครึ่งหลังของวัน ข้อมูลแสดงให้เห็นถึงการลดลงของอัตราเงินเฟ้อในอิตาลี ซึ่งสนับสนุนยูโรในช่วงครึ่งแรกของวัน เนื่องจาก

Miroslaw Bawulski 19:14 2025-06-16 UTC+2

วิธีการเทรดคู่เงิน GBP/USD ในวันที่ 16 มิถุนายน? เคล็ดลับง่าย ๆ และการวิเคราะห์การเทรดสำหรับผู้เริ่มต้น

เมื่อวันศุกร์ คู่เงิน GBP/USD แสดงการเคลื่อนไหวเกือบเหมือนกับคู่เงิน EUR/USD เนื่องจากปัจจัยสำคัญมีความเหมือนกัน การโจมตีของอิสราเอลต่ออิหร่านในช่วงค่ำได้กระตุ้นให้ดอลลาร์แข็งค่าขึ้นอย่างมาก ซึ่งก็สิ้นสุดในเวลาไม่นานเนื่องจากเทรดเดอร์นึกถึงว่าภูมิรัฐศาสตร์ในตะวันออกกลางยังไม่ใช่เรื่องที่ตลาดให้ความสำคัญในขณะนี้ รายงานเพียงชิ้นเดียวได้แก่ดัชนีความเชื่อมั่นผู้บริโภคของมหาวิทยาลัยมิชิแกน แข็งแกร่งกว่าที่คาดการณ์ไว้อย่างมาก อย่างไรก็ตามมันก็ยังไม่สนับสนุนให้ดอลลาร์แข็งค่า โดนัลด์ ทรัมป์ กำลังกำเนิดความวุ่นวายทั่วโลกอีกครั้ง คราวนี้ในตะวันออกกลาง

Paolo Greco 07:07 2025-06-16 UTC+2

วิธีการเทรดคู่เงิน EUR/USD ในวันที่ 16 มิถุนายน? เคล็ดลับง่ายๆ และการวิเคราะห์การเทรดสำหรับผู้เริ่มต้น

คืนวันศุกร์ คู่สกุลเงิน EUR/USD มีการลดลงอย่างรวดเร็ว ตามมาด้วยการฟื้นตัวตลอดทั้งวัน ดังนั้นวันทั้งหมดสามารถแบ่งได้เป็นสองช่วง ในช่วงแรก ดอลลาร์แข็งค่าขึ้นอย่างมั่นคง (สิ่งที่หายากมากในปัจจุบัน) และหลังจากนั้นตลาดก็ได้สติกลับมาและตระหนักว่าเกิดอะไรขึ้น ปฏิกิริยาเริ่มแรกของตลาดต่อการโจมตีอันรุนแรงของอิสราเอลต่ออิหร่านค่อนข้างเป็นธรรมชาติ — แต่ไม่สำหรับเงื่อนไขในวันนี้ ในอดีต ดอลลาร์จะมีมูลค่าเพิ่มขึ้นเมื่อมีความตึงเครียดทางการเมืองเกิดขึ้นทั่วโลก

Paolo Greco 07:07 2025-06-16 UTC+2
หากไม่สะดวกคุยในตอนนี้
ระบุคำถามไว้ได้ใน แชท.
Widget callback
 

Dear visitor,

Your IP address shows that you are currently located in the USA. If you are a resident of the United States, you are prohibited from using the services of InstaFintech Group including online trading, online transfers, deposit/withdrawal of funds, etc.

If you think you are seeing this message by mistake and your location is not the US, kindly proceed to the website. Otherwise, you must leave the website in order to comply with government restrictions.

Why does your IP address show your location as the USA?

  • - you are using a VPN provided by a hosting company based in the United States;
  • - your IP does not have proper WHOIS records;
  • - an error occurred in the WHOIS geolocation database.

Please confirm whether you are a US resident or not by clicking the relevant button below. If you choose the wrong option, being a US resident, you will not be able to open an account with InstaForex anyway.

We are sorry for any inconvenience caused by this message.