empty
01.02.2023 07:16 AM
GBP/USD: trading plan for European session on February 1, 2023. Commitments of Traders. Overview of yesterday's trading. GBP/USD has limited downside potential

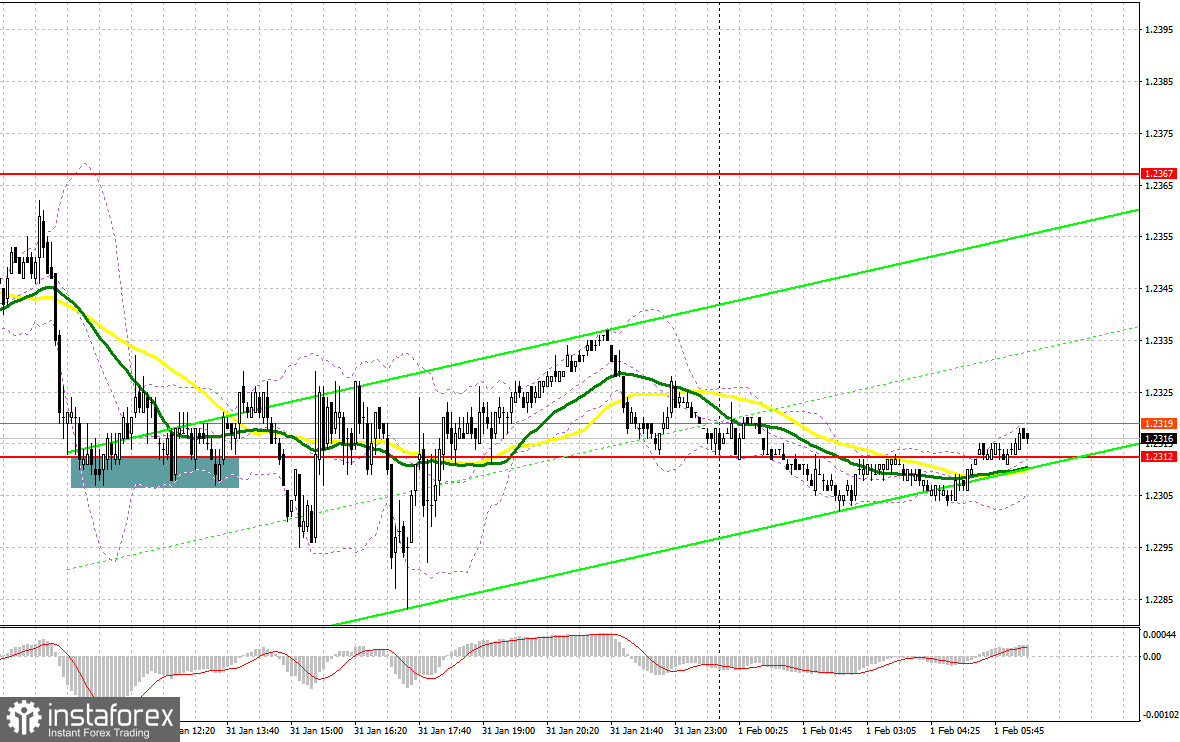
A few entry signals were generated yesterday. Let's take a look at the M5 chart to get a picture of what happened. In the first half of the day, I focused on the 1.2312 level and considered entering the market there. The pair's plunge in the European session resulted in a false breakout through 1.2312. However, after a 20 pips increase, large traders still showed signs of no return. In the second half of the day, a breakout with a buy signal repeated. However, no surge in the price followed.

This image is no longer relevant

When to open long positions on GBP/USD:

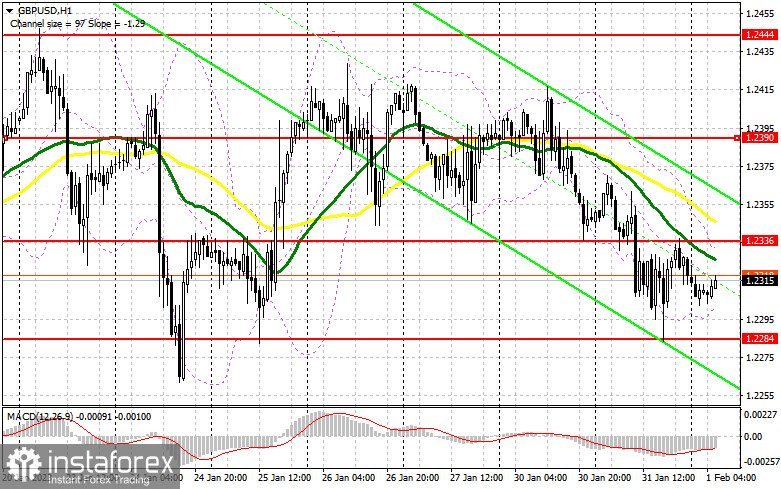
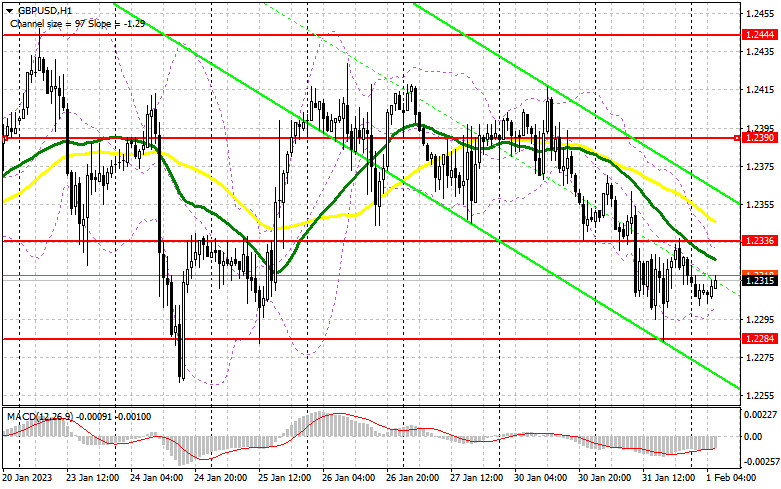
Today, the UK will see the release of the manufacturing PMI for January. However, those figures will be of little importance ahead of the FOMC meeting. Therefore, I expect the pair to move slightly up in the sideways channel. With the Bank of England's aggressive rhetoric, the pound is likely to extend growth against the greenback. If the UK's manufacturing PMI comes in disappointing and sparks a negative reaction in the market, a false breakout through 1.2284 may lead to another surge to the 1.2343 mark. In fact, the pair is currently trading near this level. The moving averages limiting the pair's growth potential are also plotted there. Therefore, it will be challenging for the bulls to push the price to the target. Consolidation and a downside retest of this range may drive the price to the 1.2390 high. In the case of the dovish Fed, the pair may go above the range, targeting 1.2444 where I am going to lock in profits. If the bulls fail and lose grip on the 1.2284 level even before the FOMC meeting, GBP/USD will feel an increase in pressure, and a correction will occur. Therefore, long positions could be opened after a false breakout through the 1.2237 low only. It will also become possible to buy GBP/USD on a rebound from 1.2172, allowing a correction of 30 to 35 pips intraday.

When to open short positions on GBP/USD:

The bears attempted to extend the corrective move yesterday. They almost succeeded. However, US consumer confidence data spoiled everything and limited the pair's downside potential. The fact that GBP/USD is now trading near the moving averages indicates market uncertainty ahead of the meetings of the Fed and the BoE. The bears should protect resistance at 1.2336. The barrier is in line with the moving averages. If the price skyrockets in the first half of the day, a false breakout through 1.2336 will generate a sell signal, targeting support at 1.2284. A breakout and a retest of the mark to the upside will produce a sell signal with the target at 1.2337. A new downtrend will begin if the price tests this level. The most distant target stands at 1.2172 where I am going to lock in profits. If GBP/USD goes up and there is no bullish activity at 1.2336, the bulls will regain control over the market. A false breakout through 1.2390 will create a sell entry point. In such a case, we may see a bear continuation. If there is no trading activity there as well, I am going to sell GBP/USD on a rebound from the 1.2444 high, allowing a bearish correction of 30 to 35 pips intraday.

This image is no longer relevant

Commitments of Traders:

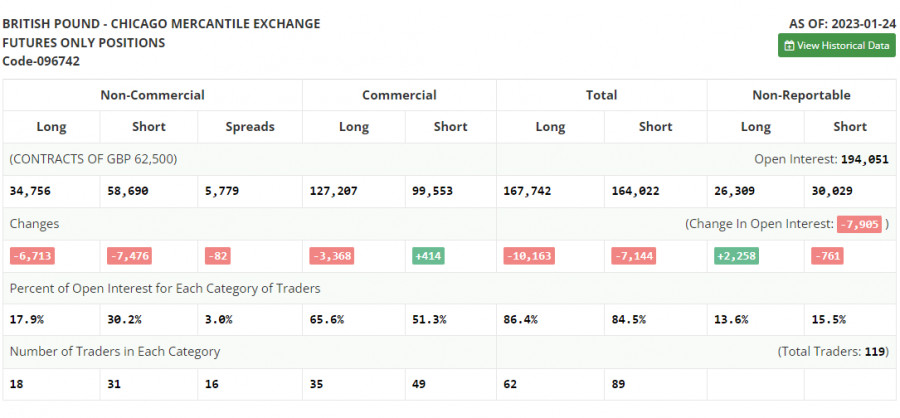
The COT report for January 24 logged a plunge in both long and short positions. However, this drop was within the limits, especially if taking into account the problems the UK is now facing. Its government has to deal with strikes for fair pay and fight against stubborn inflation at the same time. Nevertheless, all eyes are now on the upcoming meetings of the US Fed and the Bank of England. The American regulator is expected to adopt a less aggressive stance on monetary policy. Meanwhile, its British counterpart is likely to stay hawkish and raise the interest rate by 0.5%. In this light, the pound sterling may strengthen unless something extraordinary happens. According to the latest COT report, short non-commercial positions decreased by 7,476 to 58,690, and long non-commercial positions fell by 6,713 to 34,756. As a result, the non-commercial net position came in at -23,934 versus -24,697 a week ago. These are insignificant changes. Therefore, they are unlikely to affect market sentiment. That is why it is important to monitor macroeconomic reports in the UK and the BoE's rate decisions. The weekly closing price rose to 1.2350 from 1.2290.

This image is no longer relevant

Indicator signals:

Moving averages

Trading is carried out near the 30-day and 50-day moving averages, indicating market uncertainty.

Note: The period and prices of moving averages are viewed by the author on the hourly chart and differ from the general definition of classic daily moving averages on the daily chart.

Bollinger Bands

Resistance is seen at 1.2336, in line with the upper band. Support stands at 1.2300, in line with the lower band.

Indicator description:

  • Moving average (MA) determines the current trend by smoothing volatility and noise. Period 50. Colored yellow on the chart.
  • Moving average (MA) determines the current trend by smoothing volatility and noise. Period 30. Colored green on the chart.
  • Moving Average Convergence/Divergence (MACD). Fast EMA 12. Slow EMA 26. SMA 9.
  • Bollinger Bands. Period 20
  • Non-commercial traders are speculators such as individual traders, hedge funds, and large institutions who use the futures market for speculative purposes and meet certain requirements.
  • Long non-commercial positions are the total long position of non-commercial traders.
  • Non-commercial short positions are the total short position of non-commercial traders.
  • Total non-commercial net position is the difference between the short and long positions of non-commercial traders.
เลือกช่วงเวลา
5
นาที
15
นาที
30
นาที
1
ชั่วโมง
4
ชั่วโมง
1
วัน
1
สัปดาห์
รับผลกำไรจากการเปลี่ยนแปลงอัตราสกุลเงินดิจิทัลกับ InstaForex.
ดาวน์โหลด MetaTrader 4 และเปิดการซื้อขายครั้งแรกของคุณ.
USD/CAD: การวิเคราะห์และการพยากรณ์ คู่เงิน USD/CAD กำลังแสดงการฟื้นตัวเล็กน้อยจากระดับที่ต่ำกว่า 1.3600 โดยย้อนไปเกือบทั้งหมดของการสูญเสียในวันที่ผ่านมา โดยได้รับการสนับสนุนจากการฟื้นตัวของดอลลาร์สหรัฐ นอกจากนี้ ความกังวลเกี่ยวกับการหยุดชะงักในการจัดหาน้ำมันในตะวันออกกลางกำลังผลักดันราคาน้ำมันดิบให้พุ่งขึ้นอย่างรวดเร็ว ทำให้ราคาของน้ำมันแตะระดับสูงสุดในรอบห้าเดือน เนื่องจากเงินดอลลาร์แคนาดาเป็นสกุลเงินที่เชื่อมโยงกับสินค้าโภคภัณฑ์ ราคาน้ำมันจึงส่งผลต่อค่าของมันเป็นอย่างมาก ประกอบกับความเป็นไปได้ที่ลดลงของการปรับลดอัตราดอกเบี้ยเพิ่มเติมจากธนาคารกลางแคนาดาและความคาดหวังต่อข้อตกลงการค้าระหว่างสหรัฐอเมริกาและแคนาดา ปัจจัยเหล่านี้ช่วยสนับสนุนเงินดอลลาร์แคนาดา โอกาสทางการค้าที่ดีขึ้นและนโยบายการเงินของแคนาดาที่มีเสถียรภาพอาจช่วยให้
  • Grand Choice
    Contest by
    InstaForex
    InstaForex always strives to help you
    fulfill your biggest dreams.
    เข้าร่วมการแข่งขัน


บทความแนะนำ

GBP/USD: แผนการซื้อขายสำหรับช่วงตลาดอเมริกันวันที่ 13 มิถุนายน (รีวิวการซื้อขายช่วงเช้า)

ในคำพยากรณ์ช่วงเช้าของฉัน ฉันได้เน้นไปที่ระดับ 1.3531 และวางแผนตัดสินใจการซื้อขายตามระดับนี้ มาดูกราฟ 5 นาทีและวิเคราะห์สิ่งที่เกิดขึ้น การลดลงตามมาด้วยการฝ่าวงล้อมเท็จที่ระดับนี้ นำไปสู่การเข้าซื้อที่ยาวนานบนปอนด์ ส่งผลให้เกิดการขึ้นมากกว่า 35 จุด ภาพทางเทคนิคไม่ได้รับการปรับปรุงสำหรับช่วงครึ่งหลังของวัน การเปิดสถานะ Long

Miroslaw Bawulski 12:37 2025-06-13 UTC+2

EUR/USD: แผนการเทรดสำหรับการซื้อขายในสหรัฐอเมริกา วันที่ 13 มิถุนายน (รีวิวการซื้อขายในช่วงเช้า)

ในการวิเคราะห์ในช่วงเช้า ผมได้เน้นที่ระดับ 1.1556 และวางแผนการตัดสินใจเข้าตลาดตามจุดนี้ มาดูกราฟ 5 นาทีและวิเคราะห์ว่าเกิดอะไรขึ้น การเพิ่มขึ้นและการเกิดสัญญาณหลอก ๆ รอบระดับ 1.1556 ทำให้มีการเปิดตำแหน่งขา short ในยูโร ซึ่งส่งผลให้เกิดการเคลื่อนไหวมากกว่า

Miroslaw Bawulski 12:31 2025-06-13 UTC+2

วิธีการเทรดคู่สกุลเงิน GBP/USD ในวันที่ 13 มิถุนายน? เคล็ดลับง่าย ๆ และการวิเคราะห์การเทรดสำหรับมือใหม่

ในวันพฤหัสบดี คู่เงิน GBP/USD แสดงการเคลื่อนไหวขึ้นที่ค่อนข้างแข็งแกร่ง แม้ว่าปอนด์จะมีการลดลงในระหว่างวันก็ตาม มีการพัฒนาข่าวมากมาย เช่น ในช่วงตลาดยุโรป เงินปอนด์ถูกกดดันจากรายงาน GDP และการผลิตภาคอุตสาหกรรมของเดือนเมษายน — ทั้งสองตัวบ่งชี้ต่ำกว่าที่คาดการณ์ไว้และแสดงอัตราการเติบโตที่เป็นลบ แม้กระนั้น รายงานจากสหรัฐอเมริกาภายหลังแสดงว่า

Paolo Greco 06:31 2025-06-13 UTC+2

วิธีการซื้อขายคู่สกุลเงิน EUR/USD ในวันที่ 13 มิถุนายน? เคล็ดลับง่าย ๆ และการวิเคราะห์การซื้อขายสำหรับมือใหม่

คู่สกุลเงิน EUR/USD ในวันพฤหัสบดีและช่วงกลางคืนเข้าสู่วันศุกร์แสดงลักษณะ "การวิ่งแข่งแบบอเมริกัน" ในช่วงสองวันที่ผ่านมา ดอลลาร์สหรัฐฯ ได้ร่วงลงอีกครั้งเนื่องจากการประท้วงและการก่อจลาจลยังคงเป็นไปอย่างต่อเนื่องทั่วหลายเมืองในอเมริกา เพื่อตอบโต้ต่อนโยบายการอพยพของ Donald Trump ขณะเดียวกัน Trump ได้ประกาศความตั้งใจที่จะเพิ่มความตึงเครียดด้วยการเพิ่มอัตราภาษีทางการค้ากับประเทศทั้งหมดที่อยู่ใน "บัญชีดำ" ของเขา

Paolo Greco 06:31 2025-06-13 UTC+2

คำแนะนำและการวิเคราะห์การซื้อขายสำหรับ GBP/USD ในวันที่ 13 มิถุนายน: GDP ที่อ่อนแอทำให้ภาพรวมค่าเงินปอนด์แย่ลง

เมื่อวันพฤหัสบดีที่ผ่านมา คู่สกุลเงิน GBP/USD ยังคงเคลื่อนไหวในทิศทางที่เพิ่มขึ้น อย่างไรก็ตาม ต้องบอกว่าเป็นเรื่องที่น่าแปลกใจเล็กน้อยที่ในสัปดาห์นี้ค่าเงินปอนด์แข็งค่าขึ้นน้อยกว่าค่าเงินยูโร ค่าเงินปอนด์อังกฤษอยู่ภายใต้แรงกดดันจากรายงานการจ้างงานและจากนั้นก็มาจากข้อมูล GDP และข้อมูลการผลิตอุตสาหกรรม แม้ว่าก่อนหน้านี้เราจะตั้งข้อสังเกตว่ารายงานเหล่านี้ไม่มีความสำคัญมากนัก แต่ตลาดก็ยังคงตอบสนองอย่างมาก ที่สำคัญที่สุด รายงานชี้ให้เห็นถึงการลดลงของค่าเงินปอนด์ และ—แปลกใจมาก!—ตลาดในที่สุดก็ยังคงตอบสนองต่อรายงานในทางที่เป็นผลดีต่อค่าเงินดอลลาร์สหรัฐ อย่างไรก็ตาม

Paolo Greco 03:41 2025-06-13 UTC+2

คำแนะนำและการวิเคราะห์การซื้อขายสำหรับ EUR/USD ณ วันที่ 13 มิถุนายน: ทรัมป์เตือนเกี่ยวกับการเพิ่มภาษี

สกุลเงินคู่ EUR/USD ยังคงเคลื่อนที่ขึ้นอย่างแข็งแกร่งในวันพฤหัสบดี ซึ่งเริ่มต้นจากวันพุธ การถอยกลับลงเริ่มต้นเมื่อสิ้นสุดวัน แต่มีอ่อนแรงกว่าการเพิ่มขึ้นก่อนหน้านี้ การลดลงอีกระลอกหนึ่งของดอลลาร์สหรัฐเริ่มต้นหลังจากการประกาศข้อมูลเงินเฟ้อในสหรัฐฯ ซึ่งออกมาต่ำกว่าที่คาดการณ์ไว้ อย่างไรก็ตาม เราไม่เชื่อมโยงรายงานนี้โดยตรงกับการลดลงใหม่ของดอลลาร์ เงินเฟ้อออกมาต่ำกว่าความคาดหวังของตลาด แต่ยังคงเพิ่มขึ้นเล็กน้อยในเดือนพฤษภาคม หมายความว่าอย่างไร? หมายความว่าเงินเฟ้อกำลังเพิ่มขึ้น ดังนั้น

Paolo Greco 03:40 2025-06-13 UTC+2

วิธีการเทรดคู่เงิน GBP/USD ในวันที่ 12 มิถุนายน? เคล็ดลับง่ายๆ และการวิเคราะห์การเทรดสำหรับผู้เริ่มต้น

เมื่อวันพุธ คู่สกุลเงิน GBP/USD เคลื่อนไหวในลักษณะคล้ายกับคู่สกุลเงิน EUR/USD รายงานอัตราเงินเฟ้อของสหรัฐฯ กลายเป็นแรงขับเคลื่อนใหม่สำหรับการลดลงของดอลลาร์สหรัฐฯ แม้ว่าตัวเลขจะไม่ถือว่าหายนะก็ตาม อัตราเงินเฟ้อที่ยังคงอยู่ที่ 2.8% เมื่อเทียบแบบปีต่อปี หมายความว่าไม่มีการเปลี่ยนแปลงใด ๆ เกิดขึ้น อย่างไรก็ตาม

Paolo Greco 06:05 2025-06-12 UTC+2

เคล็ดลับและการวิเคราะห์การเทรดคู่สกุลเงิน EUR/USD ในวันที่ 12 มิถุนายน สำหรับมือใหม่

เมื่อวันพุธ คู่สกุลเงิน EUR/USD ได้กลับมาสู่แนวโน้มขาขึ้นอีกครั้ง ซึ่งได้ดำเนินมาต่อเนื่องมากกว่าสี่เดือน โดยเฉพาะอย่างยิ่งหลังจากที่ Donald Trump ได้เข้าเป็นประธานาธิบดี สิ่งที่เราเห็นคือคู่สกุลเงินนี้ปรับตัวขึ้นอย่างรวดเร็ว ปรับฐานลงอย่างอ่อน หรือเคลื่อนไหวแบบทรงตัวในกรอบราคาหนึ่ง ตัวอย่างเช่น สัปดาห์นี้คู่สกุลเงินเคลื่อนไหวแบบทรงตัวในช่วงราคาที่แคบเป็นเวลา 2.5

Paolo Greco 06:05 2025-06-12 UTC+2

คำแนะนำและการวิเคราะห์การซื้อขายสำหรับ GBP/USD เมื่อวันที่ 12 มิถุนายน: เงินปอนด์พบเหตุผลใหม่ในการดีใจ

ในวันพุธที่ผ่านมา สกุลเงิน GBP/USD ได้กลับมาขยับขึ้นอีกครั้ง ตามที่ได้กล่าวไว้ก่อนหน้านี้ สกุลเงินอังกฤษในปัจจุบันไม่มีเหตุผลที่ชัดเจนที่จะลดลงเมื่อเปรียบเทียบกับดอลลาร์สหรัฐ โดยเฉพาะกับดอลลาร์สหรัฐ ตลาดยังคงจับปัจจัยหรือข้ออ้างใด ๆ ที่จะขายเงินดอลลาร์ ผู้ค้าก็เริ่มไม่เชื่อในคำกล่าวของ Donald Trump ที่อ้างถึงอนาคตที่ดีและข้อตกลงที่ทำกำไรได้ ประชาชนชาวอเมริกันออกมาเดินประท้วงนโยบายการอพยพของพรรครีพับลิกัน

Paolo Greco 04:00 2025-06-12 UTC+2

คำแนะนำการซื้อขายและการวิเคราะห์ EUR/USD สำหรับวันที่ 12 มิถุนายน: แม้แต่เงินเฟ้อก็ไม่ทำให้ดอลลาร์พอใจ

คู่สกุลเงิน EUR/USD มีการซื้อขายในรูปแบบที่แตกต่างกันมากตลอดทั้งวันพุธ ระหว่างช่วงการซื้อขายในยุโรป คู่เงินยังคงเคลื่อนไหวด้านข้าง ซึ่งมีรูปแบบเช่นนี้มาหลายวัน ไม่มีปัจจัยพื้นฐานขนาดใหญ่ในขณะนั้น อีกทั้งตลาดไม่ได้รับแรงกระตุ้นจากคำกล่าวใหม่ของ Donald Trump เกี่ยวกับการทำข้อตกลงการค้ากับจีน เพราะในท้ายที่สุดทุกคนเข้าใจถึงความไม่จริงของคำกล่าวเช่นนั้น ในการประชุมครั้งที่สองที่ London จีนและสหรัฐฯ

Paolo Greco 03:55 2025-06-12 UTC+2
หากไม่สะดวกคุยในตอนนี้
ระบุคำถามไว้ได้ใน แชท.
Widget callback
 

Dear visitor,

Your IP address shows that you are currently located in the USA. If you are a resident of the United States, you are prohibited from using the services of InstaFintech Group including online trading, online transfers, deposit/withdrawal of funds, etc.

If you think you are seeing this message by mistake and your location is not the US, kindly proceed to the website. Otherwise, you must leave the website in order to comply with government restrictions.

Why does your IP address show your location as the USA?

  • - you are using a VPN provided by a hosting company based in the United States;
  • - your IP does not have proper WHOIS records;
  • - an error occurred in the WHOIS geolocation database.

Please confirm whether you are a US resident or not by clicking the relevant button below. If you choose the wrong option, being a US resident, you will not be able to open an account with InstaForex anyway.

We are sorry for any inconvenience caused by this message.