empty
13.11.2023 12:31 PM
Weekly forecast based on simplified wave analysis: GBP/USD, AUD/USD, USD/CHF, EUR/JPY, AUD/JPY, and US dollar index from November 13th

GBP/USD

Brief Analysis:

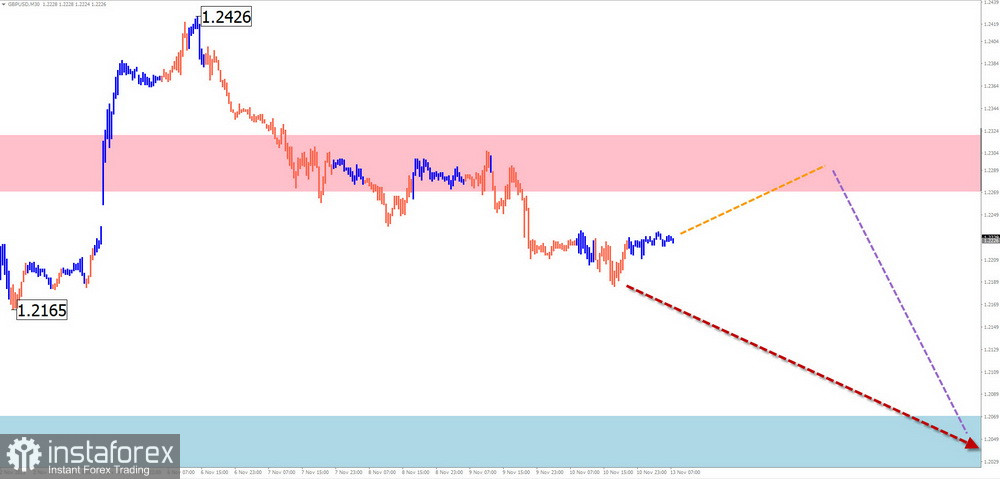
The short-term trend of the British pound has been determined by a bearish wave since mid-summer. The structure initiated the intermediate part (B) on October 4. The downward segment from November 6 has a reversal potential. Quotes are within the potential reversal zone on a weekly scale. Before continuing the trend, the price needs to be corrected.

Weekly Forecast:

The beginning of the upcoming week is expected to be flat. Price movements of the pound are likely to be in a sideways range along the resistance zone. Subsequently, a downward vector can be expected. The calculated support is located at the accumulation of potential reversal zones of different scales.

This image is no longer relevant

Potential Reversal Zones:

Resistance:

  • 1.2270/1.2320

Support:

  • 1.2070/1.2020

Recommendations:

Sales: Possible with a fractional lot in separate sessions after signals from your trading system near the resistance zone appear.

Purchases: Not recommended until the completion of the upcoming correction.

AUD/USD

Brief Analysis:

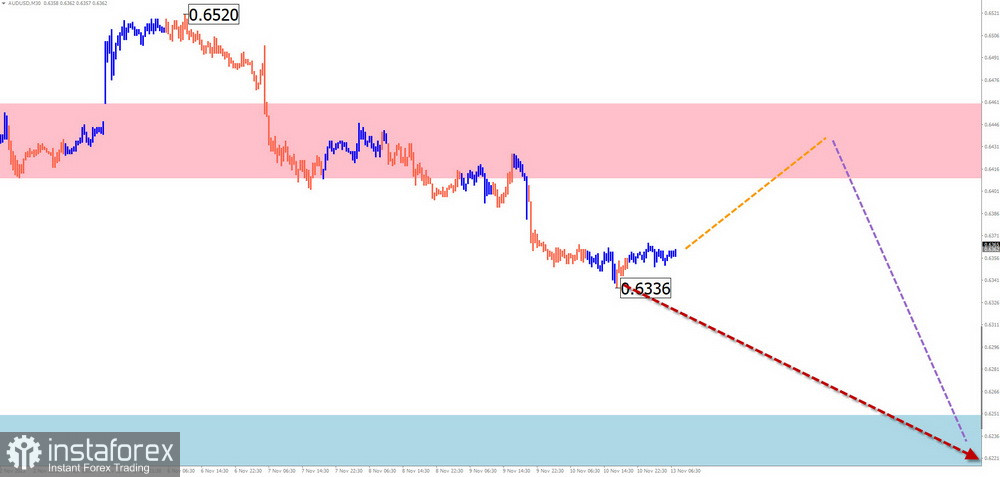
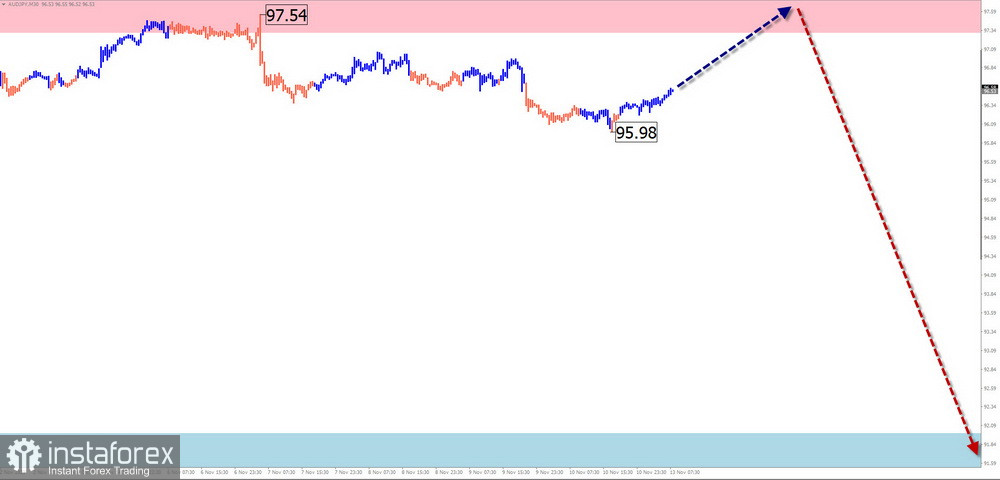
Within the dominant bearish trend, the quotes of the Australian dollar have been forming a corrective segment since October. Its magnitude does not exceed the correction level of the last part of the main wave. The downward segment from November 6 has a reversal potential. Upon confirmation, it will begin a new part of the main trend.

Weekly Forecast:

A sideways price vector is probable at the beginning of the upcoming week. Short-term growth is possible within the calculated support boundaries. Increased volatility and a resumption of downward price movement can be expected closer to the weekend. The support level demonstrates the lower boundary of the expected weekly range.

This image is no longer relevant

Potential Reversal Zones:

Resistance:

  • 0.6410/0.6460

Support:

  • 0.6250/0.6200

Recommendations:

Purchases: Risky. Due to the limited upward potential, there is a high probability of deposit loss.

Sales: This will become relevant after the appearance of corresponding signals in your used trading systems near the resistance zone.

USD/CHF

Brief Analysis:

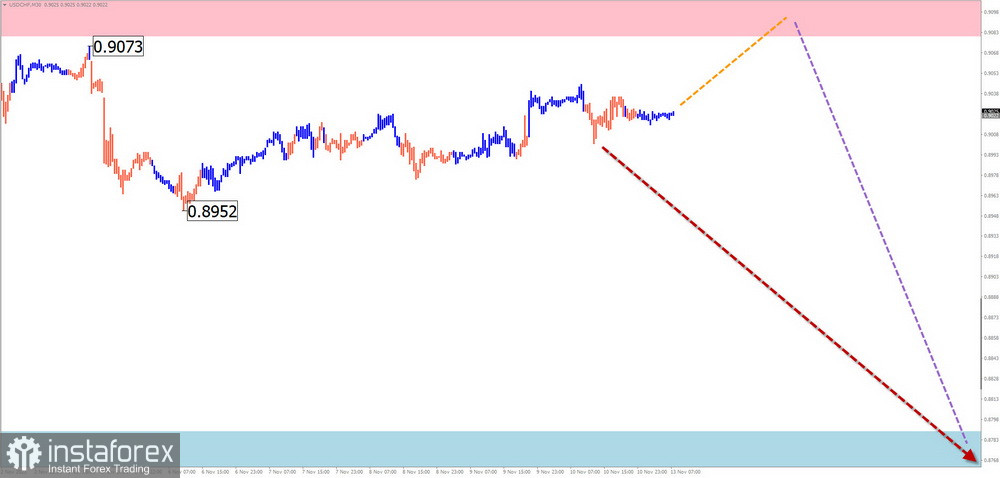
The analysis of the daily chart of the Swiss Franc shows the formation of a downward wave since November. Since July 14, the price has been correcting upward towards the main movement. The structure of this wave needs to be completed. The nearest target is the preliminary target zone, the upper limit indicated by the level of calculated support.

Weekly Forecast:

The pair's price is expected to decline throughout the current week, reaching the support zone. At the beginning of the week, a short-term price rollback upward to the resistance zone is not ruled out. The greatest activity can be expected in the second half of the week.

This image is no longer relevant

Potential Reversal Zones:

Resistance:

  • 0.9080/0.9130

Support:

  • 0.8790/0.8740

Recommendations:

Purchases: Not relevant in the coming days.

Sales: This can be used for trading after the appearance of confirmed signals in the resistance zone.

EUR/JPY

Brief Analysis:

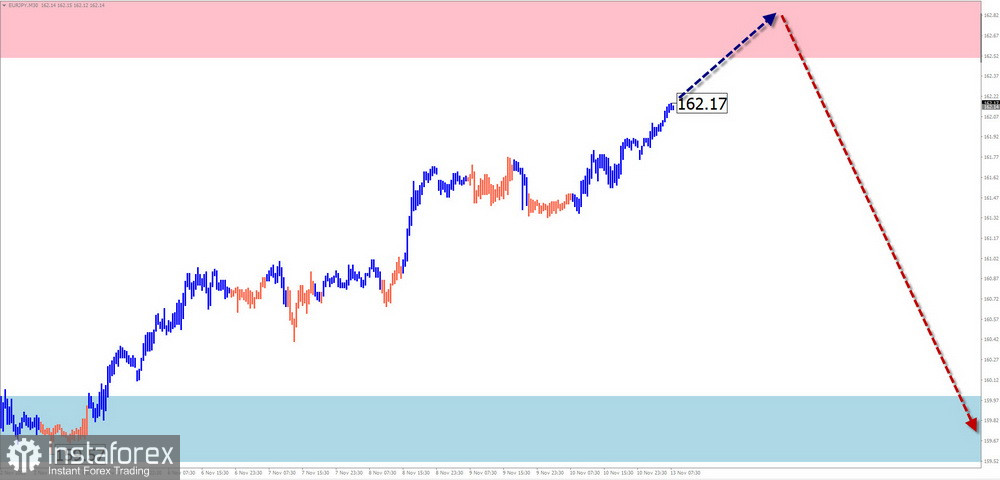
The unfinished wave structure of the euro against the Japanese yen's chart is directed upward and has been counting since July 28. Since the beginning of last month, the price has been forming the final part of the wave (C). The wave structure needs to look complete. Quotes are approaching the upper limit of the potential reversal zone on a weekly timeframe.

Weekly Forecast:

In the next couple of days, one can expect the continuation of the pair's price increase. A breakthrough beyond the resistance zone is unlikely. Towards the end of the week, against the backdrop of increased volatility, a change in direction and a resumption of price decline are expected. The calculated support indicates the lower boundary of the expected weekly range.

This image is no longer relevant

Potential Reversal Zones:

Resistance:

  • 162.50/163.00

Support:

  • 160.00/159.50

Recommendations:

Sales: Will become relevant after the appearance of reversal signals in your trading systems in the resistance zone.

Purchases: Can be used with a fractional lot in separate trading sessions.

AUD/JPY

Brief Analysis:

A flat price movement has been observed in recent months on the chart of the Australian Dollar against the Japanese yen. The unfinished wave structure has been downward since June 16. In its structure, the intermediate part (B) is approaching completion. The price is at the lower boundary of a strong resistance. There are no signals of an imminent reversal on the chart.

Weekly Forecast:

In the next few days, the most likely scenario will be an attempt to exert pressure on the resistance zone. Subsequently, one can expect a change in direction and the course of the cross towards the calculated support.

This image is no longer relevant

Potential Reversal Zones:

Resistance:

  • 97.30/97.80

Support:

  • 92.00/91.50

Recommendations:

Sales: This will become relevant after confirmed reversal signals appear in the resistance zone.

Purchases: The potential is limited by resistance. Transactions may become unprofitable.

US Dollar Index

Brief Analysis:

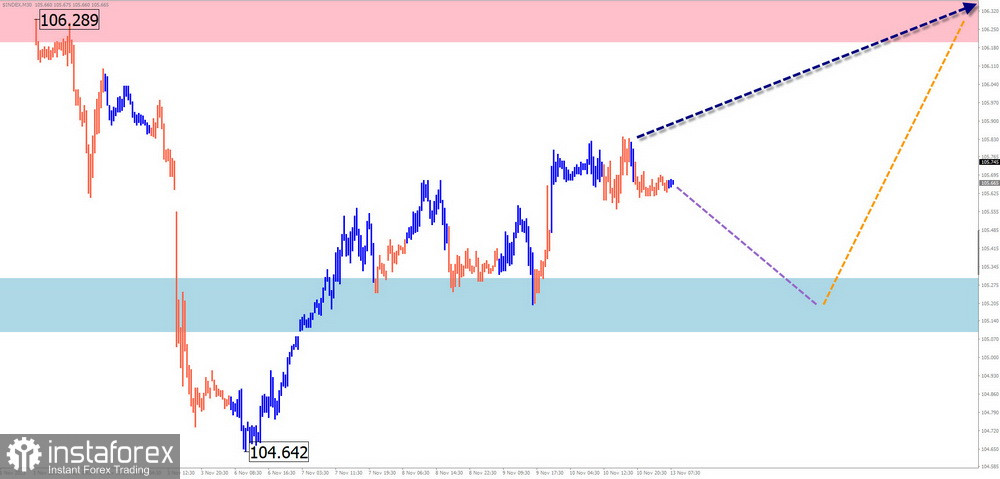
The quotes of the US Dollar have been regaining lost positions since mid-July. In the area of strong resistance, the price has been forming an upward correction since the beginning of October. Its structure looks completed at the time of the analysis. The upward segment from November 6 has a reversal potential. Upon confirmation, it will mark the beginning of the final part of the wave (C).

Weekly Forecast:

The index quotes may decline in the next few days, reaching the calculated support. After that, a sideways movement along its boundaries is expected to form a reversal and a rollback of upward index values. The limiting zone of the rise is the calculated resistance.

This image is no longer relevant

Potential Reversal Zones:

Resistance:

  • 106.20/106.40

Support:

  • 105.30/105.10

Recommendations:

Sales: Selling currencies in major pairs may be possible with a reduced lot in separate trading sessions.

Purchases: Purchases of national currencies will become relevant after the completion of the upcoming correction of the dollar index.

Note: In simplified wave analysis (SWA), all waves consist of 3 parts (A-B-C). The last unfinished wave is analyzed on each timeframe. Dashed lines indicate expected movements.

Attention: The wave algorithm does not consider the duration of instrument movements over time!

Summary
Urgency
Analytic
Vyacheslav Ognev
Start trade
รับผลกำไรจากการเปลี่ยนแปลงอัตราสกุลเงินดิจิทัลกับ InstaForex.
ดาวน์โหลด MetaTrader 4 และเปิดการซื้อขายครั้งแรกของคุณ.
  • Grand Choice
    Contest by
    InstaForex
    InstaForex always strives to help you
    fulfill your biggest dreams.
    เข้าร่วมการแข่งขัน


บทความแนะนำ

วิเคราะห์ GBP/USD – 14 กรกฎาคม ดอลลาร์ค้นพบเหตุผลใหม่ในการเฉลิมฉลอง

รูปแบบคลื่นสำหรับคู่สกุลเงิน GBP/USD ยังบ่งชี้ถึงการเกิดโครงสร้างคลื่นแรงกระตุ้นที่มีแนวโน้มขึ้น รูปคลื่นนั้นเกือบจะเหมือนกับของ EUR/USD เพราะว่าเงินดอลลาร์สหรัฐยังคงเป็นผู้เล่นหลักในตลาด ความต้องการสำหรับเงินดอลลาร์กำลังลดลงทั่วทั้งกระดาน ส่งผลให้มีพลวัตที่คล้ายกันในเครื่องมือต่างๆ คลื่นที่ 2 ของเทรนด์แนวโน้มขึ้นเกิดในรูปแบบคลื่นเดียว คลื่นที่ 3 ที่สมมุติไว้ได้เกิดขึ้นชัดเจนและแล้วเสร็จแล้ว ดังนั้นฉันคาดว่าจะมีการสร้างโครงสร้างการแก้ไขตามมา

Chin Zhao 22:23 2025-07-14 UTC+2

วิเคราะห์ EUR/USD – 14 กรกฎาคม สัปดาห์นี้เริ่มต้นไม่ดี

รูปแบบคลื่นในกราฟ 4 ชั่วโมงของเครื่องมือ EUR/USD ไม่ได้เปลี่ยนแปลงมาหลายเดือน ส่วนแนวโน้มขาขึ้นยังคงพัฒนาอย่างต่อเนื่อง และข่าวพื้นฐานยังคงสนับสนุนทุกสกุลเงินยกเว้นดอลลาร์สหรัฐ สงครามการค้าที่ Donald Trump เริ่มต้นขึ้นมีเป้าหมายเพื่อเพิ่มรายได้งบประมาณและขจัดการขาดดุลการค้า อย่างไรก็ตาม เป้าหมายเหล่านี้ยังไม่บรรลุผล ข้อตกลงทางการค้ากำลังถูกลงนามด้วยความยากลำบาก

Chin Zhao 22:19 2025-07-14 UTC+2

การคาดการณ์รายสัปดาห์โดยใช้การวิเคราะห์คลื่นแบบง่ายสำหรับ GBP/USD, AUD/USD, USD/CHF, EUR/JPY, AUD/JPY และดัชนีดอลลาร์สหรัฐ ณ วันที่ 14 กรกฎาคม

GBP/USD การวิเคราะห์: คลื่นขาขึ้นที่เริ่มต้นตั้งแต่เดือนมกราคมของปีนี้ได้เข้าสู่ช่วงการปรับฐาน ตั้งแต่ปลายเดือนที่แล้ว ราคายังคงดึงกลับจากขอบล่างของเขตกลับตัวที่แข็งแกร่งที่มีศักยภาพในตัวเองได้ บริเวณแนวรับคำนวณไว้ที่ขอบบนของเขตแนวรับใน time frame 4 ชั่วโมง การคาดการณ์: การเคลื่อนไหวแบบ Sideways คาดว่าจะเกิดขึ้นตลอดทั้งสัปดาห์ ช่วงต้นสัปดาห์อาจเห็นแนวโน้มลงไปยังแนวรับ

Isabel Clark 11:12 2025-07-14 UTC+2

การพยากรณ์รายสัปดาห์โดยใช้การวิเคราะห์คลื่นแบบง่ายสำหรับ EUR/USD, USD/JPY, GBP/JPY, USD/CAD, NZD/USD, และทองคำ ณ วันที่ 14 กรกฎาคม

EUR/USD การวิเคราะห์: แนวคลื่นขาขึ้นที่เริ่มต้นตั้งแต่เดือนกุมภาพันธ์ยังคงดำเนินต่อไปในกราฟของคู่เงินยูโรหลัก สองสัปดาห์ที่แล้ว ราคามีการถอยกลับจากขอบล่างของโซนแนวต้านที่แข็งแกร่ง เมื่อเฟสขาลงเสร็จสิ้นแล้ว คาดว่าราคาจะกลับมาเติบโตอีกครั้ง การพยากรณ์: แนวการเคลื่อนที่ด้านข้างคาดว่าจะยังคงดำเนินต่อไปในสัปดาห์หน้า คู่นี้อาจมีแนวโน้มขาลงไปยังโซนแนวรับในช่วงวันแรกๆ ก่อนที่จะมีการกลับทิศทางและเคลื่อนไหวขึ้นอีกครั้ง การเปลี่ยนทิศทางอาจส่งผลให้เกิดความผันผวนเพิ่มขึ้น โซนกลับตัวที่มีศักยภาพ แนวต้าน: 1.1810

Isabel Clark 10:57 2025-07-14 UTC+2

การวิเคราะห์ GBP/USD วันที่ 10 กรกฎาคม 2025

รูปแบบคลื่นของคู่เงิน GBP/USD ยังคงบ่งบอกถึงการก่อตัวของโครงสร้างคลื่นขาขึ้น รูปแบบคลื่นนี้คล้ายกับคู่เงิน EUR/USD อย่างมาก เนื่องจากเงินดอลลาร์ยังคงเป็นตัวขับเคลื่อนหลักของการเคลื่อนไหวในตลาด ความต้องการเงินดอลลาร์สหรัฐอ่อนแอลงในทุกภาคส่วนของตลาด ส่งผลให้เกิดการเปลี่ยนแปลงแบบเดียวกันในเครื่องมือทางการเงินหลายตัว คลื่นที่ 2 ของแนวโน้มขาขึ้นมีลักษณะเป็นคลื่นเดี่ยว ภายในสมมติฐานของคลื่นที่ 3 ได้มีการก่อตัวของคลื่นย่อยที่

Chin Zhao 21:36 2025-07-10 UTC+2

การวิเคราะห์ EUR/USD วันที่ 10 กรกฎาคม 2025

รูปแบบคลื่นในกราฟ EUR/USD ราย 4 ชั่วโมงไม่เปลี่ยนแปลงมาหลายเดือนต่อเนื่อง การก่อตัวของแนวโน้มขาขึ้นยังคงดำเนินต่อไป ซึ่งพื้นฐานข่าวยังคงสนับสนุนทุกสกุลเงินยกเว้นดอลลาร์ สงครามการค้าที่ Donald Trump เริ่มนั้นมุ่งให้รายได้จากงบประมาณเพิ่มขึ้นและลดขาดดุลการค้า อย่างไรก็ตาม เป้าหมายเหล่านี้ยังไม่บรรลุข้อตกลงการค้าที่ยังลงนามได้ยาก และกฎหมาย "One

Chin Zhao 21:33 2025-07-10 UTC+2

การวิเคราะห์ GBP/USD ในวันที่ 9 กรกฎาคม 2025

รูปแบบคลื่นสำหรับ GBP/USD ยังคงบ่งบอกถึงการก่อตัวของรูปแบบคลื่นกระตุ้นที่มีแนวโน้มขึ้น ภาพคลื่นมีลักษณะคล้ายกับ EUR/USD เป็นอย่างมาก เนื่องจากดอลลาร์สหรัฐยังคงเป็นปัจจัยขับเคลื่อนเดียวในช่วงที่ผ่านมา ความต้องการดอลลาร์กำลังลดลงทั่วทุกตลาด จึงทำให้อุปกรณ์ทางการเงินหลายอย่างแสดงพฤติกรรมที่คล้ายคลึงกัน คลื่นที่ 2 ของแนวโน้มขาขึ้นได้มีลักษณะเป็นคลื่นเดี่ยว ภายในคลื่นที่ 3 ที่สมมติไว้

Chin Zhao 21:01 2025-07-09 UTC+2

การวิเคราะห์ EUR/USD ในวันที่ 9 กรกฎาคม 2025

รูปแบบคลื่นในกราฟ 4 ชั่วโมงสำหรับคู่เงิน EUR/USD ยังไม่มีการเปลี่ยนแปลงติดต่อกันเป็นเวลาหลายเดือน การสร้างแนวโน้มขาขึ้นยังคงดำเนินต่อไป ขณะที่แบ็คกราวน์ข่าวยังคงสนับสนุนทุกสกุลเงิน ยกเว้น ดอลลาร์ สงครามการค้าเริ่มโดย Donald Trump เพื่อหวังเพิ่มรายได้งบประมาณและลดการขาดดุลการค้า อย่างไรก็ตามเป้าหมายเหล่านี้ยังไม่สำเร็จ การเซ็นข้อตกลงการค้ามีความยากลำบาก

Chin Zhao 20:56 2025-07-09 UTC+2

วิเคราะห์ EUR/USD ประจำวันที่ 8 กรกฎาคม 2025

รูปแบบคลื่นในกราฟ EUR/USD ระดับ 4 ชั่วโมง มีความสม่ำเสมอเป็นระยะเวลาหลายเดือนแล้ว ส่วนแนวโน้มขาขึ้นยังคงก่อตัว และสถานการณ์ข่าวสนับสนุนค่าเงินทั้งหมดยกเว้นดอลลาร์สหรัฐ สงครามการค้าที่ Donald Trump เป็นผู้ริเริ่ม มีเป้าหมายเพื่อเพิ่มรายได้งบประมาณและลดการขาดดุลการค้า แต่เป้าหมายเหล่านี้ยังไม่บรรลุผล การทำข้อตกลงทางการค้าเป็นไปอย่างเชื่องช้า

Chin Zhao 20:00 2025-07-08 UTC+2

การวิเคราะห์ GBP/USD วันที่ 8 กรกฎาคม 2025

รูปแบบคลื่นสำหรับ GBP/USD ยังคงบ่งชี้ถึงการเกิดโครงสร้างคลื่นขาขึ้นที่แข็งแรง รูปแบบคลื่นนี้เกือบจะเหมือนกับของ EUR/USD เนื่องจากดอลลาร์สหรัฐยังคงเป็นตัวขับเคลื่อนหลัก ความต้องการซื้อดอลลาร์ลดลงทั่วตลาด ซึ่งเป็นสาเหตุที่หลายๆ เครื่องมือแสดงถึงพลวัตที่คล้ายคลึงกัน คลื่น 2 ของแนวโน้มขาขึ้นได้มีรูปแบบคลื่นลูกเดียว ภายในคลื่นที่สันนิษฐานคือคลื่น 3 คลื่น

Chin Zhao 19:46 2025-07-08 UTC+2
หากไม่สะดวกคุยในตอนนี้
ระบุคำถามไว้ได้ใน แชท.
Widget callback
 

Dear visitor,

Your IP address shows that you are currently located in the USA. If you are a resident of the United States, you are prohibited from using the services of InstaFintech Group including online trading, online transfers, deposit/withdrawal of funds, etc.

If you think you are seeing this message by mistake and your location is not the US, kindly proceed to the website. Otherwise, you must leave the website in order to comply with government restrictions.

Why does your IP address show your location as the USA?

  • - you are using a VPN provided by a hosting company based in the United States;
  • - your IP does not have proper WHOIS records;
  • - an error occurred in the WHOIS geolocation database.

Please confirm whether you are a US resident or not by clicking the relevant button below. If you choose the wrong option, being a US resident, you will not be able to open an account with InstaForex anyway.

We are sorry for any inconvenience caused by this message.